29
/
en
AIzaSyAYiBZKx7MnpbEhh9jyipgxe19OcubqV5w
April 1, 2024
158666
Iraq
IRQ
true
2
1
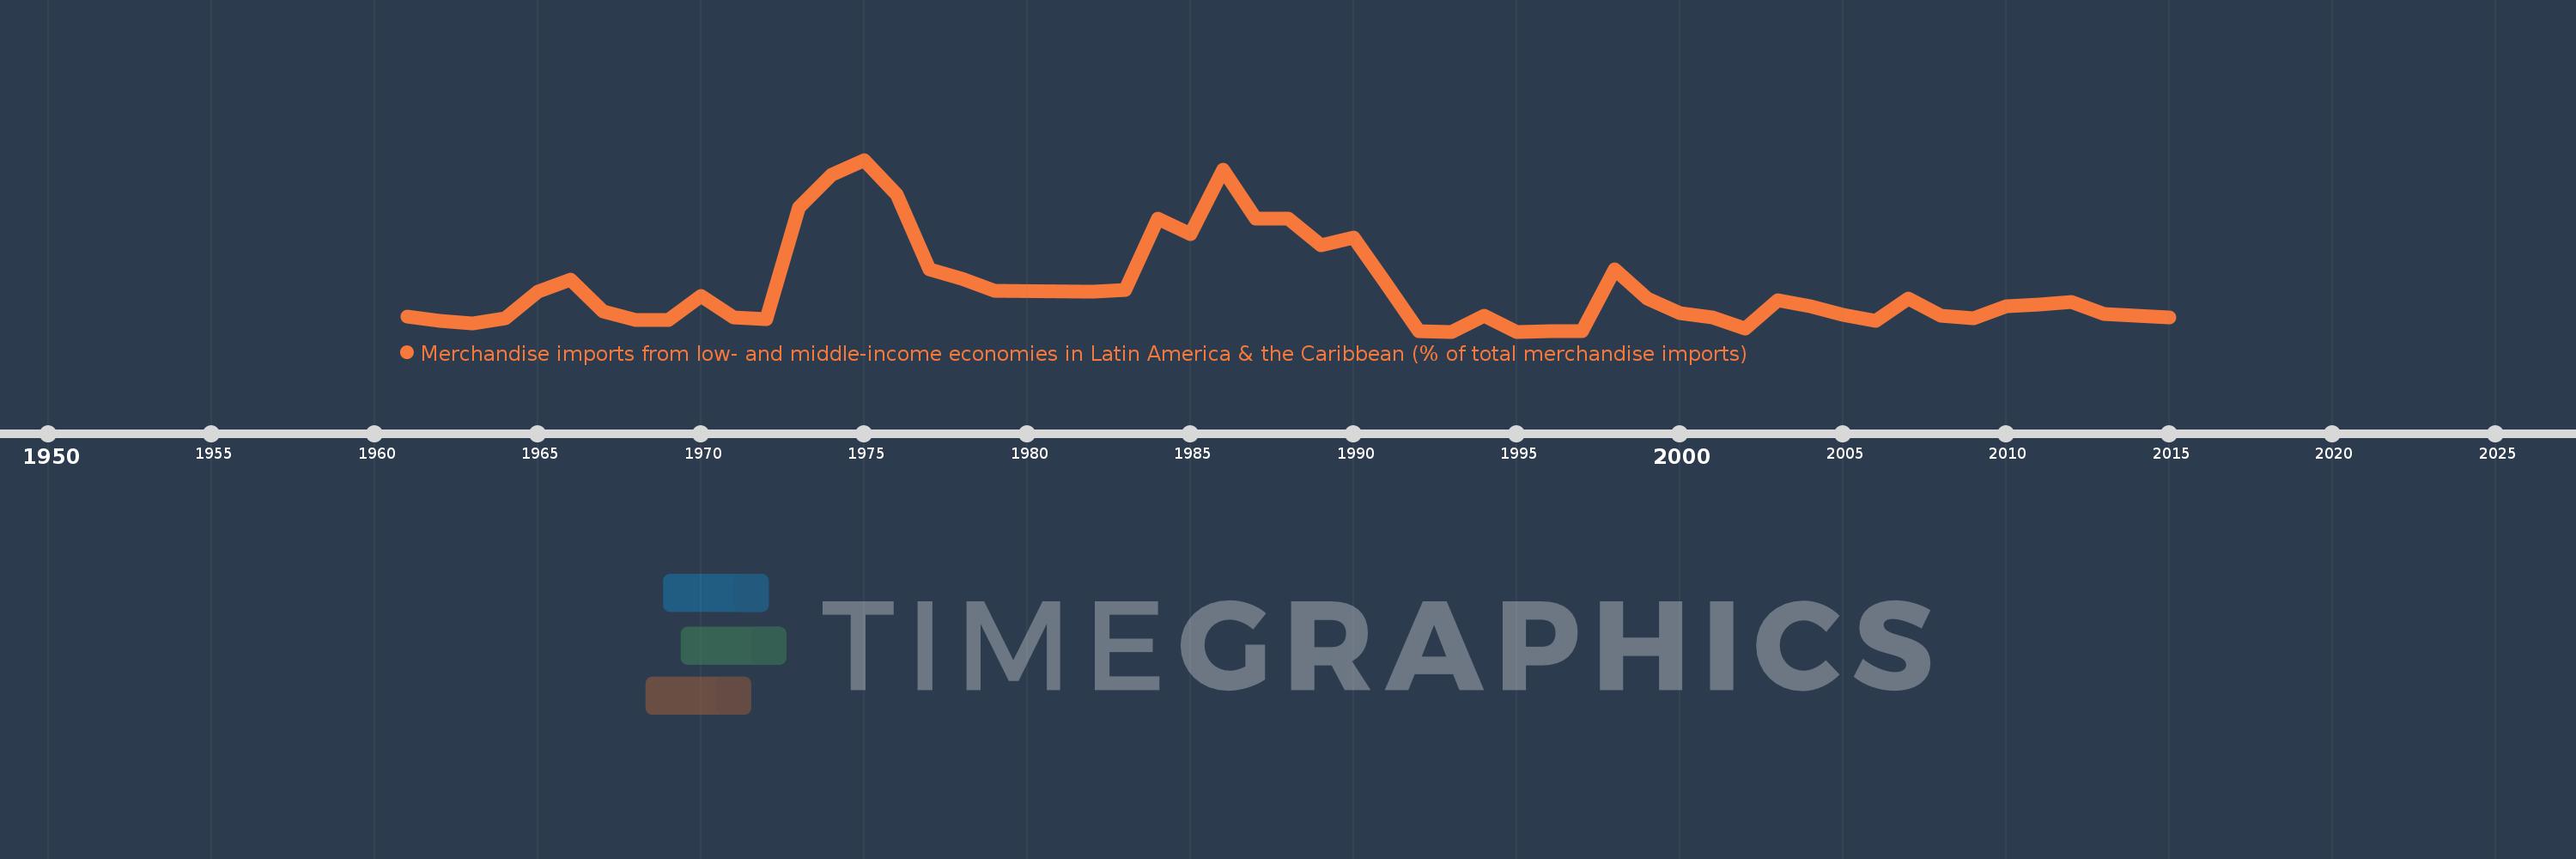
Merchandise imports from low- and middle-income economies in Latin America & the Caribbean (% of total merchandise imports)
2015,2014,2013,2012,2011,2010,2009,2008,2007,2006,2005,2004,2003,2002,2001,2000,1999,1998,1997,1996,1995,1994,1993,1992,1991,1990,1989,1988,1987,1986,1985,1984,1983,1982,1979,1978,1977,1976,1975,1974,1973,1972,1971,1970,1969,1968,1967,1966,1965,1964,1963,1962,1961
Global statistics library →Iraq →Merchandise imports from low- and middle-income economies in Latin America & the Caribbean (% of total merchandise imports)
This statistics in other country:
AfghanistanAlbaniaAlgeriaAngolaAntigua and BarbudaArab WorldArgentinaArmeniaArubaAustraliaAustriaAzerbaijanBahamas, TheBahrainBangladeshBarbadosBelarusBelgiumBelizeBeninBermudaBoliviaBrazilBrunei DarussalamBulgariaBurkina FasoCabo VerdeCambodiaCameroonCanadaCaribbean small statesCentral African RepublicCentral Europe and the BalticsChileChinaColombiaCongo, Dem. Rep.Congo, Rep.Costa RicaCote d'IvoireCroatiaCubaCyprusCzech RepublicDenmarkDominicaDominican RepublicEarly-demographic dividendEast Asia & PacificEast Asia & Pacific (excluding high income)East Asia & Pacific (IDA & IBRD countries)EcuadorEgypt, Arab Rep.El SalvadorEstoniaEthiopiaEuro areaEurope & Central AsiaEurope & Central Asia (excluding high income)Europe & Central Asia (IDA & IBRD countries)European UnionFaroe IslandsFijiFinlandFragile and conflict affected situationsFranceFrench PolynesiaGabonGambia, TheGeorgiaGermanyGhanaGibraltarGreeceGreenlandGrenadaGuatemalaGuineaGuyanaHaitiHeavily indebted poor countries (HIPC)High incomeHondurasHong Kong SAR, ChinaHungaryIBRD onlyIcelandIDA & IBRD totalIDA blendIDA onlyIDA totalIndiaIndonesiaIran, Islamic Rep.IraqIrelandIsraelItalyJamaicaJapanJordanKazakhstanKenyaKorea, Dem. People’s Rep.Korea, Rep.KuwaitKyrgyz RepublicLate-demographic dividendLatin America & Caribbean Latin America & Caribbean (excluding high income)Latin America & the Caribbean (IDA & IBRD countries)LatviaLeast developed countries: UN classificationLebanonLiberiaLibyaLithuaniaLow & middle incomeLow incomeLower middle incomeLuxembourgMacao SAR, ChinaMacedonia, FYRMadagascarMalawiMalaysiaMaldivesMaliMaltaMauritaniaMauritiusMexicoMiddle East & North AfricaMiddle East & North Africa (excluding high income)Middle East & North Africa (IDA & IBRD countries)Middle incomeMoldovaMongoliaMontenegroMoroccoMozambiqueNetherlandsNew CaledoniaNew ZealandNicaraguaNigerNigeriaNorth AmericaNorwayOECD membersOmanOther small statesPacific island small statesPakistanPanamaPapua New GuineaParaguayPeruPhilippinesPolandPortugalPost-demographic dividendPre-demographic dividendQatarRomaniaRussian FederationSaudi ArabiaSenegalSerbiaSierra LeoneSingaporeSlovak RepublicSloveniaSmall statesSomaliaSouth AfricaSouth AsiaSouth Asia (IDA & IBRD)SpainSri LankaSt. Kitts and NevisSt. LuciaSt. Vincent and the GrenadinesSub-Saharan Africa Sub-Saharan Africa (excluding high income)Sub-Saharan Africa (IDA & IBRD countries)SudanSurinameSwedenSwitzerlandSyrian Arab RepublicTanzaniaThailandTogoTrinidad and TobagoTunisiaTurkeyUgandaUkraineUnited Arab EmiratesUnited KingdomUnited StatesUpper middle incomeUruguayVenezuela, RBVietnamWorldYemen, Rep.ZambiaZimbabwe Timeline:
This timeline shows a graph from 1961 to 2015 of Iraq. No data until 1960. Number of actual observations by date: 53.
Source name:
World Development Indicators
Source organization:
World Bank staff estimates based data from International Monetary Fund's Direction of Trade database.
Categories, topics:
Private Sector, Trade
Last updated:
apr 23, 2017
Indicators value changes by year
At the date of observation
Value
Absolute change
Change from previous value
jan 1, 1961
0.62
+0.62
0.0%
jan 1, 1962
0.448
-0.172
-27.74%
jan 1, 1963
0.337
-0.111
-24.8%
jan 1, 1964
0.545
+0.208
61.79%
jan 1, 1965
1.613
+1.068
195.9%
jan 1, 1966
2.112
+0.499
30.91%
jan 1, 1967
0.814
-1.298
-61.47%
jan 1, 1968
0.473
-0.341
-41.93%
jan 1, 1969
0.484
+0.011
2.32%
jan 1, 1970
1.455
+0.971
200.82%
jan 1, 1971
0.594
-0.861
-59.16%
jan 1, 1972
0.51
-0.084
-14.14%
jan 1, 1973
5.047
+4.537
889.61%
jan 1, 1974
6.395
+1.348
26.7%
jan 1, 1975
7.0
+0.605
9.46%
jan 1, 1976
5.591
-1.408
-20.12%
jan 1, 1977
2.526
-3.065
-54.82%
jan 1, 1978
2.158
-0.368
-14.56%
jan 1, 1979
1.648
-0.511
-23.66%
jan 1, 1982
1.612
-0.035
-2.15%
jan 1, 1983
1.708
+0.096
5.94%
jan 1, 1984
4.604
+2.896
169.57%
jan 1, 1985
3.958
-0.645
-14.02%
jan 1, 1986
6.613
+2.655
67.07%
jan 1, 1987
4.587
-2.026
-30.63%
jan 1, 1988
4.601
+0.014
0.3%
jan 1, 1989
3.524
-1.077
-23.41%
jan 1, 1990
3.835
+0.311
8.83%
jan 1, 1991
1.94
-1.895
-49.42%
jan 1, 1992
0.014
-1.926
-99.26%
jan 1, 1993
0.0
-0.014
-100.0%
jan 1, 1995
0.0
-0.65
-100.0%
jan 1, 1996
0.001
+0.001
%
jan 1, 1997
0.007
+0.006
547.24%
jan 1, 1998
2.544
+2.537
37.46K%
jan 1, 1999
1.359
-1.185
-46.56%
jan 1, 2000
0.748
-0.612
-45.01%
jan 1, 2001
0.57
-0.178
-23.75%
jan 1, 2002
0.116
-0.454
-79.73%
jan 1, 2003
1.277
+1.161
1.0K%
jan 1, 2004
1.037
-0.24
-18.76%
jan 1, 2005
0.668
-0.369
-35.6%
jan 1, 2006
0.451
-0.217
-32.51%
jan 1, 2007
1.339
+0.888
197.1%
jan 1, 2008
0.658
-0.681
-50.87%
jan 1, 2009
0.543
-0.115
-17.42%
jan 1, 2010
1.042
+0.498
91.68%
jan 1, 2011
1.087
+0.045
4.32%
jan 1, 2012
1.196
+0.11
10.1%
jan 1, 2013
0.705
-0.491
-41.08%
jan 1, 2014
0.641
-0.064
-9.12%
jan 1, 2015
0.569
-0.071
-11.12%
Ranking of countries by current statistics by years


Comments: