29
/
en
AIzaSyAYiBZKx7MnpbEhh9jyipgxe19OcubqV5w
April 1, 2024
226172
Portugal
PRT
true
2
1
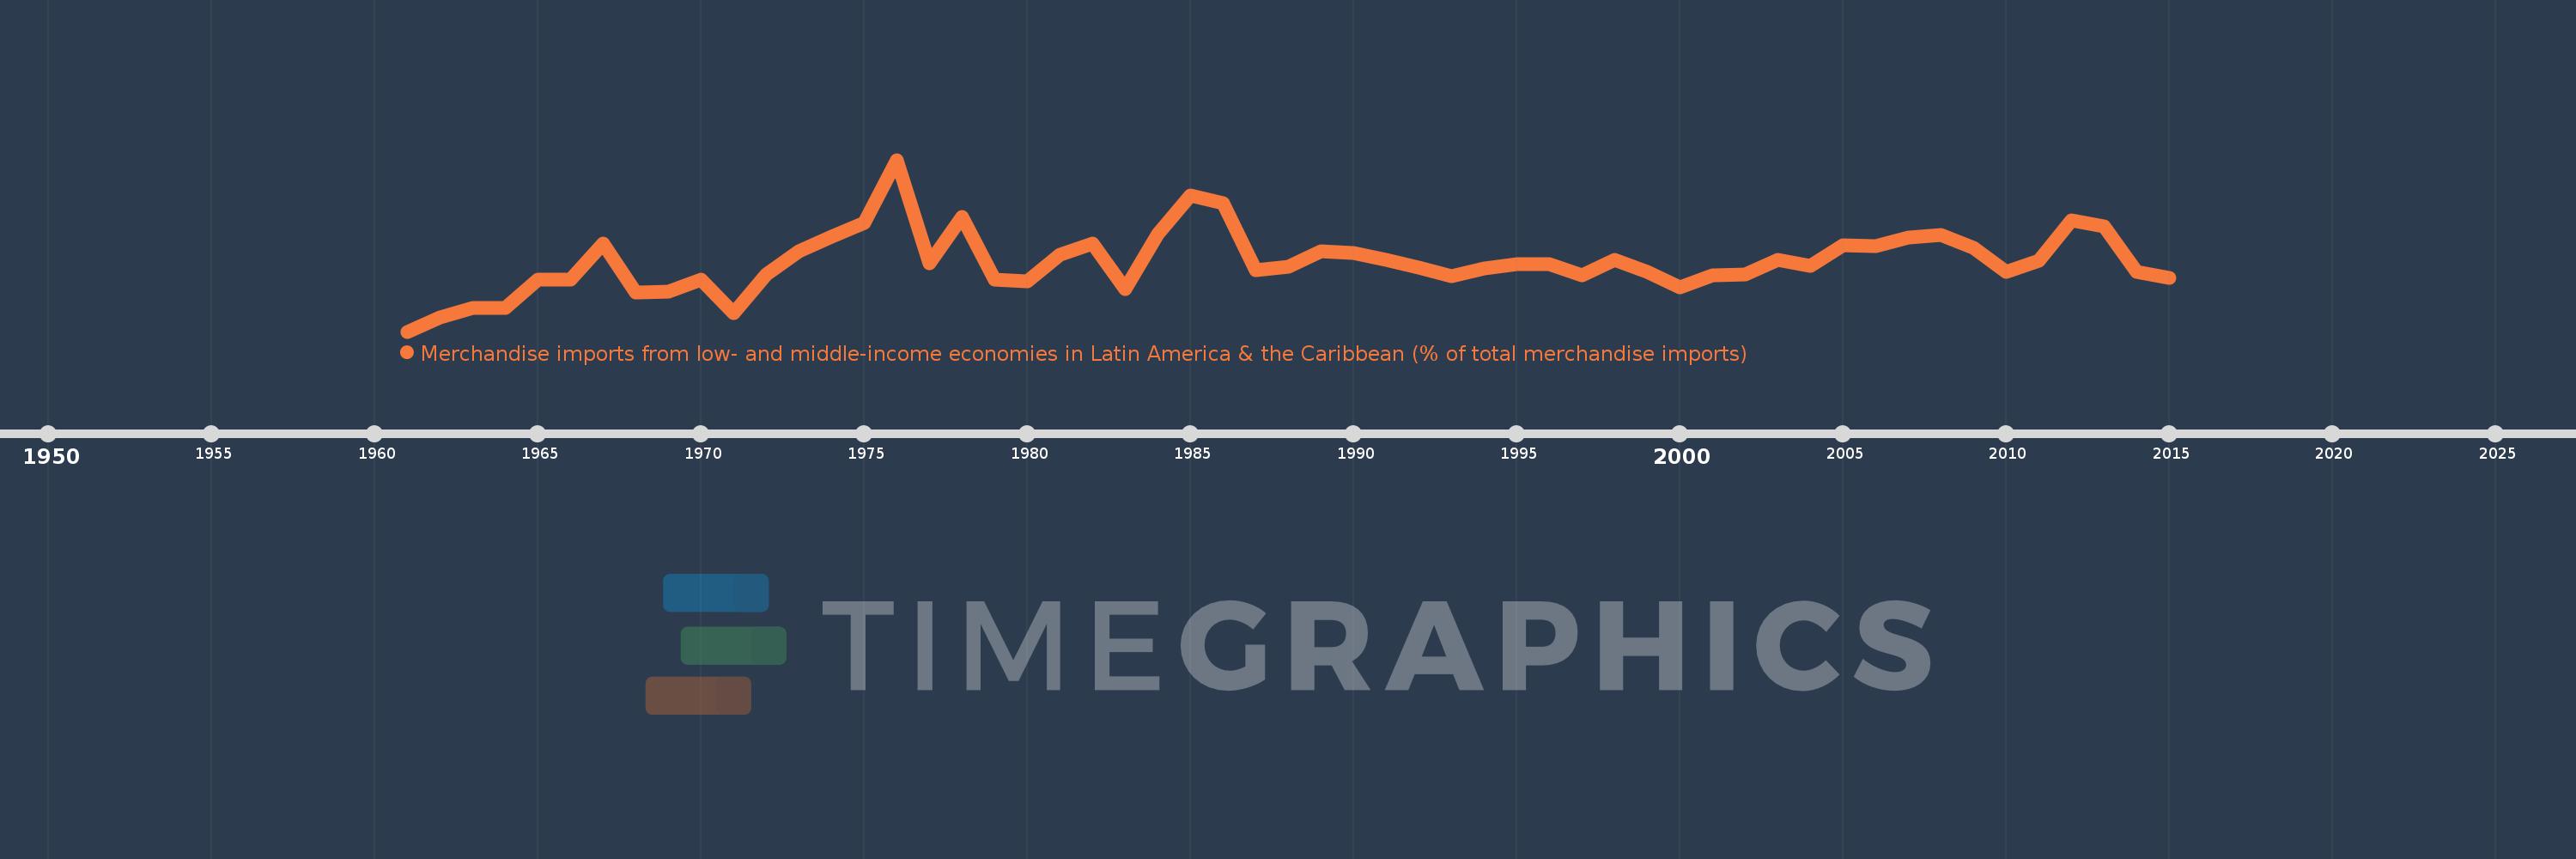
Merchandise imports from low- and middle-income economies in Latin America & the Caribbean (% of total merchandise imports)
2015,2014,2013,2012,2011,2010,2009,2008,2007,2006,2005,2004,2003,2002,2001,2000,1999,1998,1997,1996,1995,1994,1993,1992,1991,1990,1989,1988,1987,1986,1985,1984,1983,1982,1981,1980,1979,1978,1977,1976,1975,1974,1973,1972,1971,1970,1969,1968,1967,1966,1965,1964,1963,1962,1961
This statistics in other country:
AfghanistanAlbaniaAlgeriaAngolaAntigua and BarbudaArab WorldArgentinaArmeniaArubaAustraliaAustriaAzerbaijanBahamas, TheBahrainBangladeshBarbadosBelarusBelgiumBelizeBeninBermudaBoliviaBrazilBrunei DarussalamBulgariaBurkina FasoCabo VerdeCambodiaCameroonCanadaCaribbean small statesCentral African RepublicCentral Europe and the BalticsChileChinaColombiaCongo, Dem. Rep.Congo, Rep.Costa RicaCote d'IvoireCroatiaCubaCyprusCzech RepublicDenmarkDominicaDominican RepublicEarly-demographic dividendEast Asia & PacificEast Asia & Pacific (excluding high income)East Asia & Pacific (IDA & IBRD countries)EcuadorEgypt, Arab Rep.El SalvadorEstoniaEthiopiaEuro areaEurope & Central AsiaEurope & Central Asia (excluding high income)Europe & Central Asia (IDA & IBRD countries)European UnionFaroe IslandsFijiFinlandFragile and conflict affected situationsFranceFrench PolynesiaGabonGambia, TheGeorgiaGermanyGhanaGibraltarGreeceGreenlandGrenadaGuatemalaGuineaGuyanaHaitiHeavily indebted poor countries (HIPC)High incomeHondurasHong Kong SAR, ChinaHungaryIBRD onlyIcelandIDA & IBRD totalIDA blendIDA onlyIDA totalIndiaIndonesiaIran, Islamic Rep.IraqIrelandIsraelItalyJamaicaJapanJordanKazakhstanKenyaKorea, Dem. People’s Rep.Korea, Rep.KuwaitKyrgyz RepublicLate-demographic dividendLatin America & Caribbean Latin America & Caribbean (excluding high income)Latin America & the Caribbean (IDA & IBRD countries)LatviaLeast developed countries: UN classificationLebanonLiberiaLibyaLithuaniaLow & middle incomeLow incomeLower middle incomeLuxembourgMacao SAR, ChinaMacedonia, FYRMadagascarMalawiMalaysiaMaldivesMaliMaltaMauritaniaMauritiusMexicoMiddle East & North AfricaMiddle East & North Africa (excluding high income)Middle East & North Africa (IDA & IBRD countries)Middle incomeMoldovaMongoliaMontenegroMoroccoMozambiqueNetherlandsNew CaledoniaNew ZealandNicaraguaNigerNigeriaNorth AmericaNorwayOECD membersOmanOther small statesPacific island small statesPakistanPanamaPapua New GuineaParaguayPeruPhilippinesPolandPortugalPost-demographic dividendPre-demographic dividendQatarRomaniaRussian FederationSaudi ArabiaSenegalSerbiaSierra LeoneSingaporeSlovak RepublicSloveniaSmall statesSomaliaSouth AfricaSouth AsiaSouth Asia (IDA & IBRD)SpainSri LankaSt. Kitts and NevisSt. LuciaSt. Vincent and the GrenadinesSub-Saharan Africa Sub-Saharan Africa (excluding high income)Sub-Saharan Africa (IDA & IBRD countries)SudanSurinameSwedenSwitzerlandSyrian Arab RepublicTanzaniaThailandTogoTrinidad and TobagoTunisiaTurkeyUgandaUkraineUnited Arab EmiratesUnited KingdomUnited StatesUpper middle incomeUruguayVenezuela, RBVietnamWorldYemen, Rep.ZambiaZimbabwe Timeline:
This timeline shows a graph from 1961 to 2015 of Portugal. No data until 1960. Number of actual observations by date: 55.
Source name:
World Development Indicators
Source organization:
World Bank staff estimates based data from International Monetary Fund's Direction of Trade database.
Categories, topics:
Private Sector, Trade
Last updated:
apr 23, 2017
Indicators value changes by year
At the date of observation
Value
Absolute change
Change from previous value
jan 1, 1961
0.797
+0.797
0.0%
jan 1, 1962
1.172
+0.375
47.07%
jan 1, 1963
1.418
+0.246
20.97%
jan 1, 1964
1.409
-0.009
-0.65%
jan 1, 1965
2.136
+0.727
51.64%
jan 1, 1966
2.153
+0.017
0.81%
jan 1, 1967
3.086
+0.933
43.31%
jan 1, 1968
1.806
-1.28
-41.47%
jan 1, 1969
1.832
+0.025
1.39%
jan 1, 1970
2.15
+0.319
17.39%
jan 1, 1971
1.265
-0.885
-41.14%
jan 1, 1972
2.269
+1.004
79.34%
jan 1, 1973
2.873
+0.603
26.58%
jan 1, 1974
3.263
+0.39
13.58%
jan 1, 1975
3.604
+0.341
10.45%
jan 1, 1976
5.25
+1.646
45.66%
jan 1, 1977
2.557
-2.693
-51.29%
jan 1, 1978
3.764
+1.207
47.19%
jan 1, 1979
2.151
-1.613
-42.85%
jan 1, 1980
2.097
-0.055
-2.54%
jan 1, 1981
2.793
+0.697
33.23%
jan 1, 1982
3.076
+0.283
10.13%
jan 1, 1983
1.901
-1.175
-38.2%
jan 1, 1984
3.317
+1.416
74.49%
jan 1, 1985
4.318
+1.001
30.17%
jan 1, 1986
4.131
-0.187
-4.33%
jan 1, 1987
2.381
-1.749
-42.35%
jan 1, 1988
2.488
+0.106
4.47%
jan 1, 1989
2.874
+0.386
15.53%
jan 1, 1990
2.829
-0.045
-1.55%
jan 1, 1991
2.66
-0.17
-6.0%
jan 1, 1992
2.457
-0.203
-7.62%
jan 1, 1993
2.233
-0.224
-9.12%
jan 1, 1994
2.439
+0.206
9.25%
jan 1, 1995
2.549
+0.11
4.5%
jan 1, 1996
2.539
-0.01
-0.38%
jan 1, 1997
2.265
-0.274
-10.79%
jan 1, 1998
2.667
+0.402
17.73%
jan 1, 1999
2.337
-0.33
-12.39%
jan 1, 2000
1.944
-0.392
-16.79%
jan 1, 2001
2.257
+0.313
16.09%
jan 1, 2002
2.267
+0.01
0.42%
jan 1, 2003
2.662
+0.395
17.43%
jan 1, 2004
2.507
-0.155
-5.81%
jan 1, 2005
3.028
+0.521
20.78%
jan 1, 2006
3.019
-0.009
-0.31%
jan 1, 2007
3.245
+0.226
7.49%
jan 1, 2008
3.3
+0.055
1.7%
jan 1, 2009
2.971
-0.329
-9.96%
jan 1, 2010
2.348
-0.623
-20.97%
jan 1, 2011
2.636
+0.287
12.23%
jan 1, 2012
3.69
+1.054
39.99%
jan 1, 2013
3.524
-0.166
-4.5%
jan 1, 2014
2.354
-1.169
-33.19%
jan 1, 2015
2.188
-0.166
-7.05%
Ranking of countries by current statistics by years


Comments: