29
/
en
AIzaSyAYiBZKx7MnpbEhh9jyipgxe19OcubqV5w
April 1, 2024
76415
Bahamas, The
BHS
true
2
1
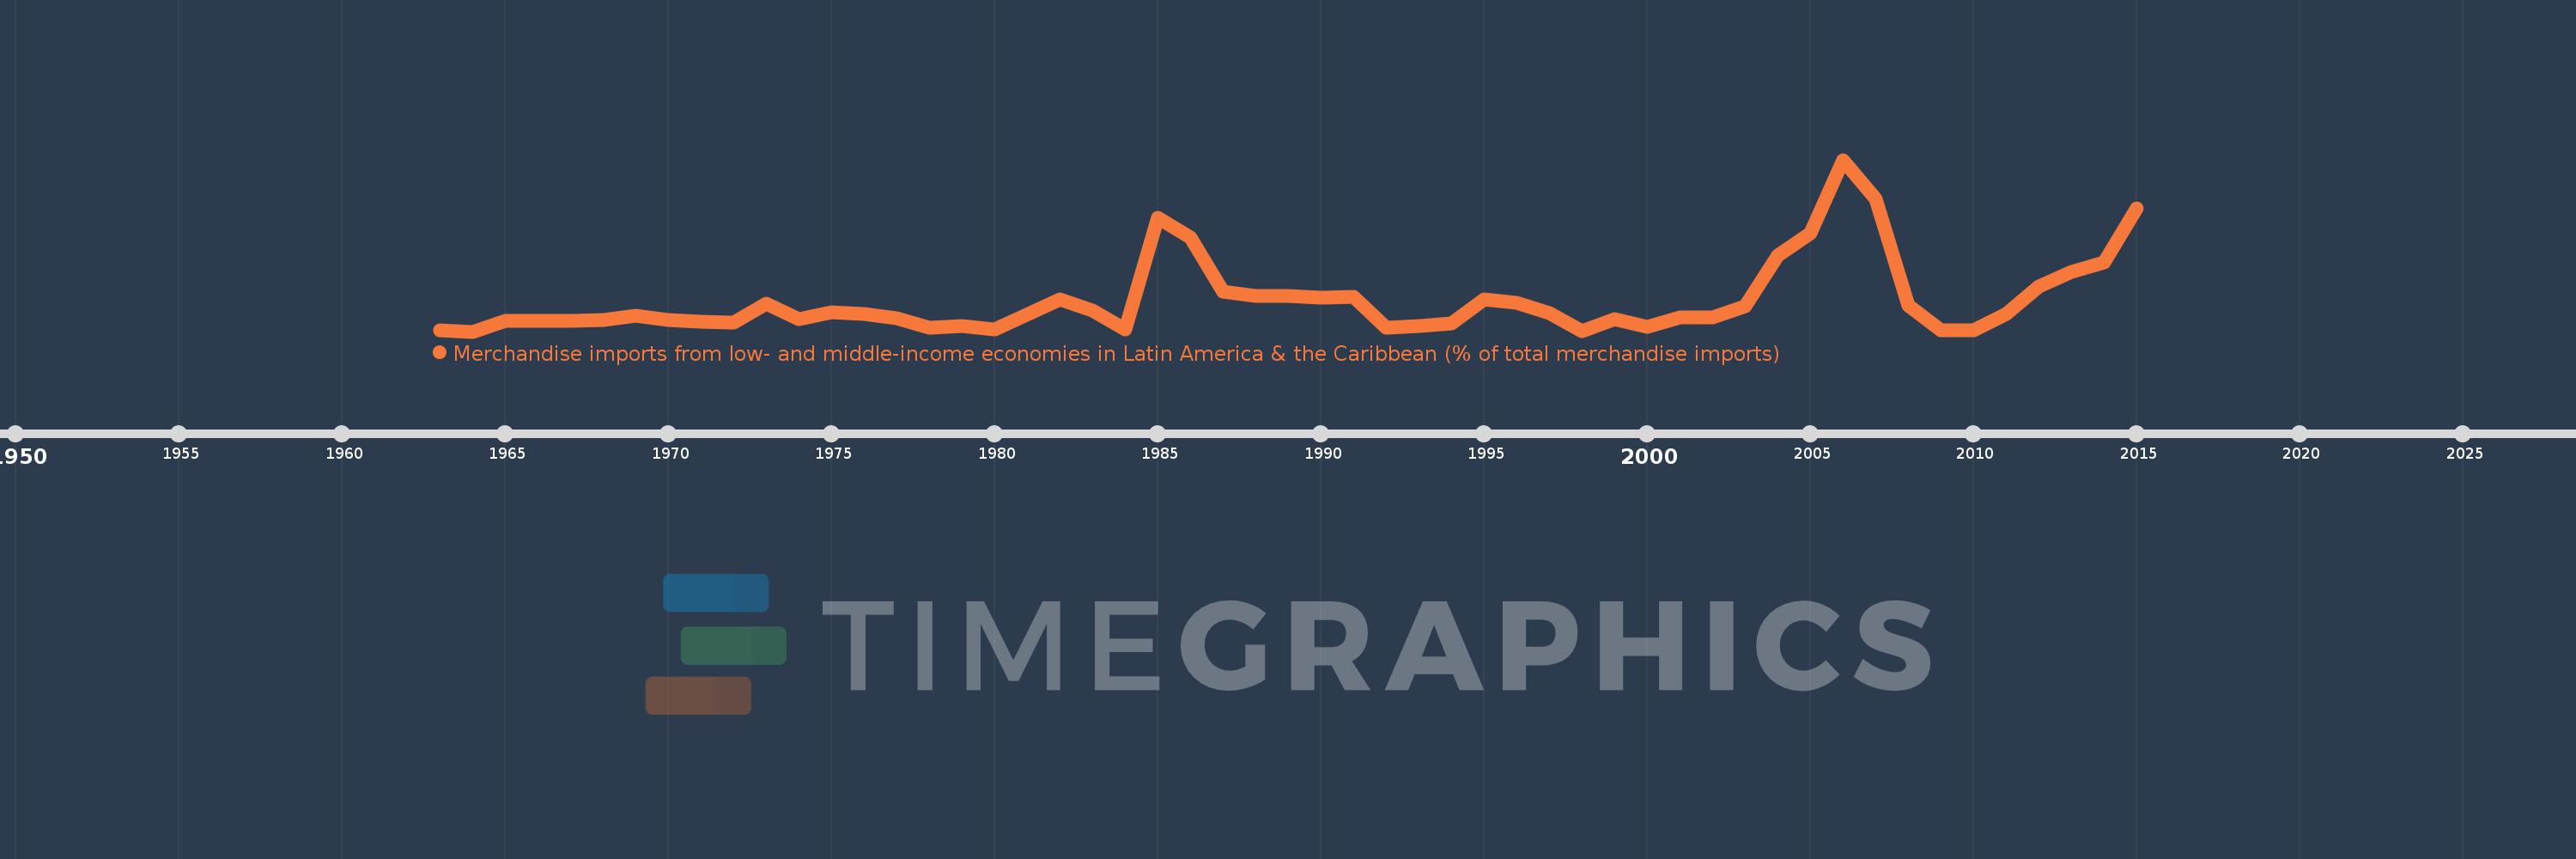
Merchandise imports from low- and middle-income economies in Latin America & the Caribbean (% of total merchandise imports)
2015,2014,2013,2012,2011,2010,2009,2008,2007,2006,2005,2004,2003,2002,2001,2000,1999,1998,1997,1996,1995,1994,1993,1992,1991,1990,1989,1988,1987,1986,1985,1984,1983,1982,1980,1979,1978,1977,1976,1975,1974,1973,1972,1971,1970,1969,1968,1967,1965,1964,1963
This statistics in other country:
AfghanistanAlbaniaAlgeriaAngolaAntigua and BarbudaArab WorldArgentinaArmeniaArubaAustraliaAustriaAzerbaijanBahamas, TheBahrainBangladeshBarbadosBelarusBelgiumBelizeBeninBermudaBoliviaBrazilBrunei DarussalamBulgariaBurkina FasoCabo VerdeCambodiaCameroonCanadaCaribbean small statesCentral African RepublicCentral Europe and the BalticsChileChinaColombiaCongo, Dem. Rep.Congo, Rep.Costa RicaCote d'IvoireCroatiaCubaCyprusCzech RepublicDenmarkDominicaDominican RepublicEarly-demographic dividendEast Asia & PacificEast Asia & Pacific (excluding high income)East Asia & Pacific (IDA & IBRD countries)EcuadorEgypt, Arab Rep.El SalvadorEstoniaEthiopiaEuro areaEurope & Central AsiaEurope & Central Asia (excluding high income)Europe & Central Asia (IDA & IBRD countries)European UnionFaroe IslandsFijiFinlandFragile and conflict affected situationsFranceFrench PolynesiaGabonGambia, TheGeorgiaGermanyGhanaGibraltarGreeceGreenlandGrenadaGuatemalaGuineaGuyanaHaitiHeavily indebted poor countries (HIPC)High incomeHondurasHong Kong SAR, ChinaHungaryIBRD onlyIcelandIDA & IBRD totalIDA blendIDA onlyIDA totalIndiaIndonesiaIran, Islamic Rep.IraqIrelandIsraelItalyJamaicaJapanJordanKazakhstanKenyaKorea, Dem. People’s Rep.Korea, Rep.KuwaitKyrgyz RepublicLate-demographic dividendLatin America & Caribbean Latin America & Caribbean (excluding high income)Latin America & the Caribbean (IDA & IBRD countries)LatviaLeast developed countries: UN classificationLebanonLiberiaLibyaLithuaniaLow & middle incomeLow incomeLower middle incomeLuxembourgMacao SAR, ChinaMacedonia, FYRMadagascarMalawiMalaysiaMaldivesMaliMaltaMauritaniaMauritiusMexicoMiddle East & North AfricaMiddle East & North Africa (excluding high income)Middle East & North Africa (IDA & IBRD countries)Middle incomeMoldovaMongoliaMontenegroMoroccoMozambiqueNetherlandsNew CaledoniaNew ZealandNicaraguaNigerNigeriaNorth AmericaNorwayOECD membersOmanOther small statesPacific island small statesPakistanPanamaPapua New GuineaParaguayPeruPhilippinesPolandPortugalPost-demographic dividendPre-demographic dividendQatarRomaniaRussian FederationSaudi ArabiaSenegalSerbiaSierra LeoneSingaporeSlovak RepublicSloveniaSmall statesSomaliaSouth AfricaSouth AsiaSouth Asia (IDA & IBRD)SpainSri LankaSt. Kitts and NevisSt. LuciaSt. Vincent and the GrenadinesSub-Saharan Africa Sub-Saharan Africa (excluding high income)Sub-Saharan Africa (IDA & IBRD countries)SudanSurinameSwedenSwitzerlandSyrian Arab RepublicTanzaniaThailandTogoTrinidad and TobagoTunisiaTurkeyUgandaUkraineUnited Arab EmiratesUnited KingdomUnited StatesUpper middle incomeUruguayVenezuela, RBVietnamWorldYemen, Rep.ZambiaZimbabwe Timeline:
This timeline shows a graph from 1963 to 2015 of Bahamas, The. No data until 1962. Number of actual observations by date: 51.
Source name:
World Development Indicators
Source organization:
World Bank staff estimates based data from International Monetary Fund's Direction of Trade database.
Categories, topics:
Private Sector, Trade
Last updated:
apr 23, 2017
Indicators value changes by year
Maximum:
19.007
jan 1, 2006
At the date of observation
Value
Absolute change
Change from previous value
jan 1, 1963
1.312
+1.312
0.0%
jan 1, 1964
1.139
-0.173
-13.16%
jan 1, 1965
2.282
+1.143
100.29%
jan 1, 1967
2.243
-0.039
-1.69%
jan 1, 1968
2.367
+0.124
5.54%
jan 1, 1969
2.769
+0.401
16.96%
jan 1, 1970
2.327
-0.442
-15.95%
jan 1, 1971
2.179
-0.148
-6.36%
jan 1, 1972
2.084
-0.095
-4.37%
jan 1, 1973
4.061
+1.977
94.84%
jan 1, 1974
2.441
-1.619
-39.87%
jan 1, 1975
3.158
+0.717
29.35%
jan 1, 1976
2.955
-0.204
-6.45%
jan 1, 1977
2.499
-0.455
-15.41%
jan 1, 1978
1.54
-0.96
-38.39%
jan 1, 1979
1.758
+0.219
14.2%
jan 1, 1980
1.326
-0.432
-24.56%
jan 1, 1982
4.453
+3.126
235.68%
jan 1, 1983
3.295
-1.157
-25.99%
jan 1, 1984
1.326
-1.969
-59.75%
jan 1, 1985
12.963
+11.636
877.24%
jan 1, 1986
10.89
-2.073
-15.99%
jan 1, 1987
5.298
-5.592
-51.35%
jan 1, 1988
4.802
-0.496
-9.35%
jan 1, 1989
4.813
+0.01
0.21%
jan 1, 1990
4.691
-0.121
-2.52%
jan 1, 1991
4.797
+0.106
2.25%
jan 1, 1992
1.5
-3.297
-68.73%
jan 1, 1993
1.752
+0.252
16.79%
jan 1, 1994
2.03
+0.278
15.85%
jan 1, 1995
4.45
+2.42
119.24%
jan 1, 1996
4.16
-0.29
-6.53%
jan 1, 1997
3.069
-1.091
-26.23%
jan 1, 1998
1.216
-1.852
-60.37%
jan 1, 1999
2.443
+1.227
100.93%
jan 1, 2000
1.655
-0.788
-32.26%
jan 1, 2001
2.595
+0.94
56.77%
jan 1, 2002
2.589
-0.006
-0.23%
jan 1, 2003
3.787
+1.198
46.26%
jan 1, 2004
9.08
+5.294
139.79%
jan 1, 2005
11.378
+2.297
25.3%
jan 1, 2006
19.007
+7.63
67.06%
jan 1, 2007
14.963
-4.045
-21.28%
jan 1, 2008
3.854
-11.108
-74.24%
jan 1, 2009
1.279
-2.575
-66.82%
jan 1, 2010
1.234
-0.045
-3.52%
jan 1, 2011
2.958
+1.724
139.76%
jan 1, 2012
5.83
+2.872
97.08%
jan 1, 2013
7.376
+1.547
26.53%
jan 1, 2014
8.374
+0.998
13.53%
jan 1, 2015
13.939
+5.565
66.45%
Ranking of countries by current statistics by years


Comments: