29
/
en
AIzaSyAYiBZKx7MnpbEhh9jyipgxe19OcubqV5w
April 1, 2024
159675
Ireland
IRL
true
2
1
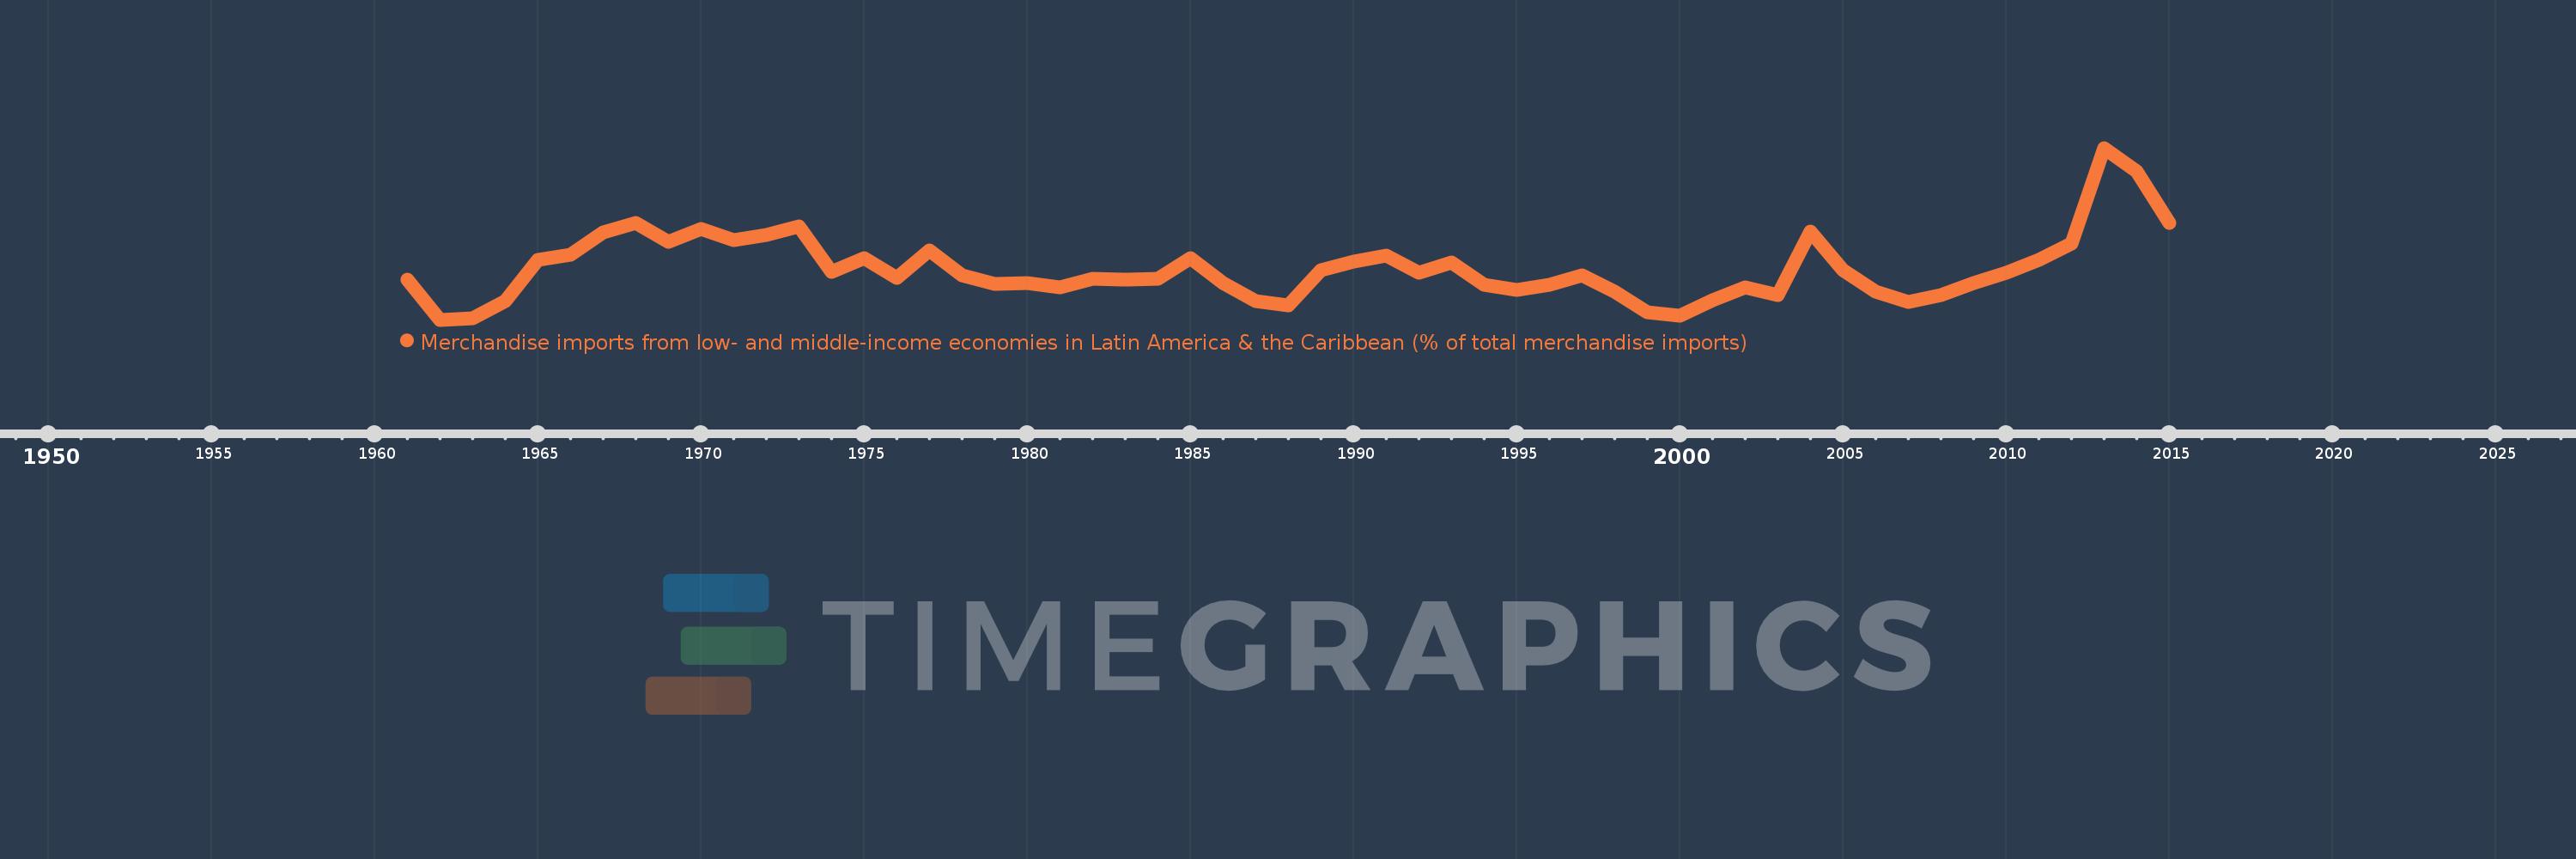
Merchandise imports from low- and middle-income economies in Latin America & the Caribbean (% of total merchandise imports)
2015,2014,2013,2012,2011,2010,2009,2008,2007,2006,2005,2004,2003,2002,2001,2000,1999,1998,1997,1996,1995,1994,1993,1992,1991,1990,1989,1988,1987,1986,1985,1984,1983,1982,1981,1980,1979,1978,1977,1976,1975,1974,1973,1972,1971,1970,1969,1968,1967,1966,1965,1964,1963,1962,1961
This statistics in other country:
AfghanistanAlbaniaAlgeriaAngolaAntigua and BarbudaArab WorldArgentinaArmeniaArubaAustraliaAustriaAzerbaijanBahamas, TheBahrainBangladeshBarbadosBelarusBelgiumBelizeBeninBermudaBoliviaBrazilBrunei DarussalamBulgariaBurkina FasoCabo VerdeCambodiaCameroonCanadaCaribbean small statesCentral African RepublicCentral Europe and the BalticsChileChinaColombiaCongo, Dem. Rep.Congo, Rep.Costa RicaCote d'IvoireCroatiaCubaCyprusCzech RepublicDenmarkDominicaDominican RepublicEarly-demographic dividendEast Asia & PacificEast Asia & Pacific (excluding high income)East Asia & Pacific (IDA & IBRD countries)EcuadorEgypt, Arab Rep.El SalvadorEstoniaEthiopiaEuro areaEurope & Central AsiaEurope & Central Asia (excluding high income)Europe & Central Asia (IDA & IBRD countries)European UnionFaroe IslandsFijiFinlandFragile and conflict affected situationsFranceFrench PolynesiaGabonGambia, TheGeorgiaGermanyGhanaGibraltarGreeceGreenlandGrenadaGuatemalaGuineaGuyanaHaitiHeavily indebted poor countries (HIPC)High incomeHondurasHong Kong SAR, ChinaHungaryIBRD onlyIcelandIDA & IBRD totalIDA blendIDA onlyIDA totalIndiaIndonesiaIran, Islamic Rep.IraqIrelandIsraelItalyJamaicaJapanJordanKazakhstanKenyaKorea, Dem. People’s Rep.Korea, Rep.KuwaitKyrgyz RepublicLate-demographic dividendLatin America & Caribbean Latin America & Caribbean (excluding high income)Latin America & the Caribbean (IDA & IBRD countries)LatviaLeast developed countries: UN classificationLebanonLiberiaLibyaLithuaniaLow & middle incomeLow incomeLower middle incomeLuxembourgMacao SAR, ChinaMacedonia, FYRMadagascarMalawiMalaysiaMaldivesMaliMaltaMauritaniaMauritiusMexicoMiddle East & North AfricaMiddle East & North Africa (excluding high income)Middle East & North Africa (IDA & IBRD countries)Middle incomeMoldovaMongoliaMontenegroMoroccoMozambiqueNetherlandsNew CaledoniaNew ZealandNicaraguaNigerNigeriaNorth AmericaNorwayOECD membersOmanOther small statesPacific island small statesPakistanPanamaPapua New GuineaParaguayPeruPhilippinesPolandPortugalPost-demographic dividendPre-demographic dividendQatarRomaniaRussian FederationSaudi ArabiaSenegalSerbiaSierra LeoneSingaporeSlovak RepublicSloveniaSmall statesSomaliaSouth AfricaSouth AsiaSouth Asia (IDA & IBRD)SpainSri LankaSt. Kitts and NevisSt. LuciaSt. Vincent and the GrenadinesSub-Saharan Africa Sub-Saharan Africa (excluding high income)Sub-Saharan Africa (IDA & IBRD countries)SudanSurinameSwedenSwitzerlandSyrian Arab RepublicTanzaniaThailandTogoTrinidad and TobagoTunisiaTurkeyUgandaUkraineUnited Arab EmiratesUnited KingdomUnited StatesUpper middle incomeUruguayVenezuela, RBVietnamWorldYemen, Rep.ZambiaZimbabwe Timeline:
This timeline shows a graph from 1961 to 2015 of Ireland. No data until 1960. Number of actual observations by date: 55.
Source name:
World Development Indicators
Source organization:
World Bank staff estimates based data from International Monetary Fund's Direction of Trade database.
Categories, topics:
Private Sector, Trade
Last updated:
apr 23, 2017
Indicators value changes by year
At the date of observation
Value
Absolute change
Change from previous value
jan 1, 1961
0.667
+0.667
0.0%
jan 1, 1962
0.384
-0.283
-42.38%
jan 1, 1963
0.393
+0.009
2.27%
jan 1, 1964
0.516
+0.123
31.39%
jan 1, 1965
0.806
+0.29
56.13%
jan 1, 1966
0.839
+0.033
4.11%
jan 1, 1967
0.998
+0.159
18.98%
jan 1, 1968
1.066
+0.067
6.74%
jan 1, 1969
0.929
-0.137
-12.86%
jan 1, 1970
1.023
+0.094
10.11%
jan 1, 1971
0.942
-0.081
-7.89%
jan 1, 1972
0.979
+0.037
3.98%
jan 1, 1973
1.039
+0.06
6.12%
jan 1, 1974
0.72
-0.32
-30.75%
jan 1, 1975
0.816
+0.097
13.42%
jan 1, 1976
0.678
-0.138
-16.93%
jan 1, 1977
0.872
+0.194
28.57%
jan 1, 1978
0.698
-0.174
-19.92%
jan 1, 1979
0.637
-0.061
-8.74%
jan 1, 1980
0.643
+0.006
0.96%
jan 1, 1981
0.614
-0.029
-4.53%
jan 1, 1982
0.67
+0.055
9.02%
jan 1, 1983
0.667
-0.003
-0.41%
jan 1, 1984
0.669
+0.002
0.32%
jan 1, 1985
0.818
+0.149
22.29%
jan 1, 1986
0.64
-0.178
-21.75%
jan 1, 1987
0.514
-0.126
-19.76%
jan 1, 1988
0.487
-0.027
-5.22%
jan 1, 1989
0.729
+0.242
49.7%
jan 1, 1990
0.794
+0.065
8.95%
jan 1, 1991
0.833
+0.039
4.86%
jan 1, 1992
0.712
-0.12
-14.46%
jan 1, 1993
0.786
+0.074
10.38%
jan 1, 1994
0.628
-0.158
-20.15%
jan 1, 1995
0.591
-0.037
-5.83%
jan 1, 1996
0.631
+0.039
6.65%
jan 1, 1997
0.697
+0.066
10.47%
jan 1, 1998
0.584
-0.112
-16.12%
jan 1, 1999
0.438
-0.146
-25.05%
jan 1, 2000
0.414
-0.024
-5.52%
jan 1, 2001
0.522
+0.108
26.11%
jan 1, 2002
0.613
+0.091
17.47%
jan 1, 2003
0.559
-0.054
-8.84%
jan 1, 2004
1.003
+0.445
79.56%
jan 1, 2005
0.73
-0.274
-27.28%
jan 1, 2006
0.582
-0.148
-20.26%
jan 1, 2007
0.51
-0.072
-12.38%
jan 1, 2008
0.558
+0.048
9.43%
jan 1, 2009
0.643
+0.085
15.32%
jan 1, 2010
0.714
+0.071
10.98%
jan 1, 2011
0.804
+0.091
12.69%
jan 1, 2012
0.917
+0.113
14.01%
jan 1, 2013
1.59
+0.672
73.31%
jan 1, 2014
1.428
-0.162
-10.18%
jan 1, 2015
1.062
-0.365
-25.59%
Ranking of countries by current statistics by years


Comments: