29
/
en
AIzaSyAYiBZKx7MnpbEhh9jyipgxe19OcubqV5w
April 1, 2024
154905
India
IND
true
2
1
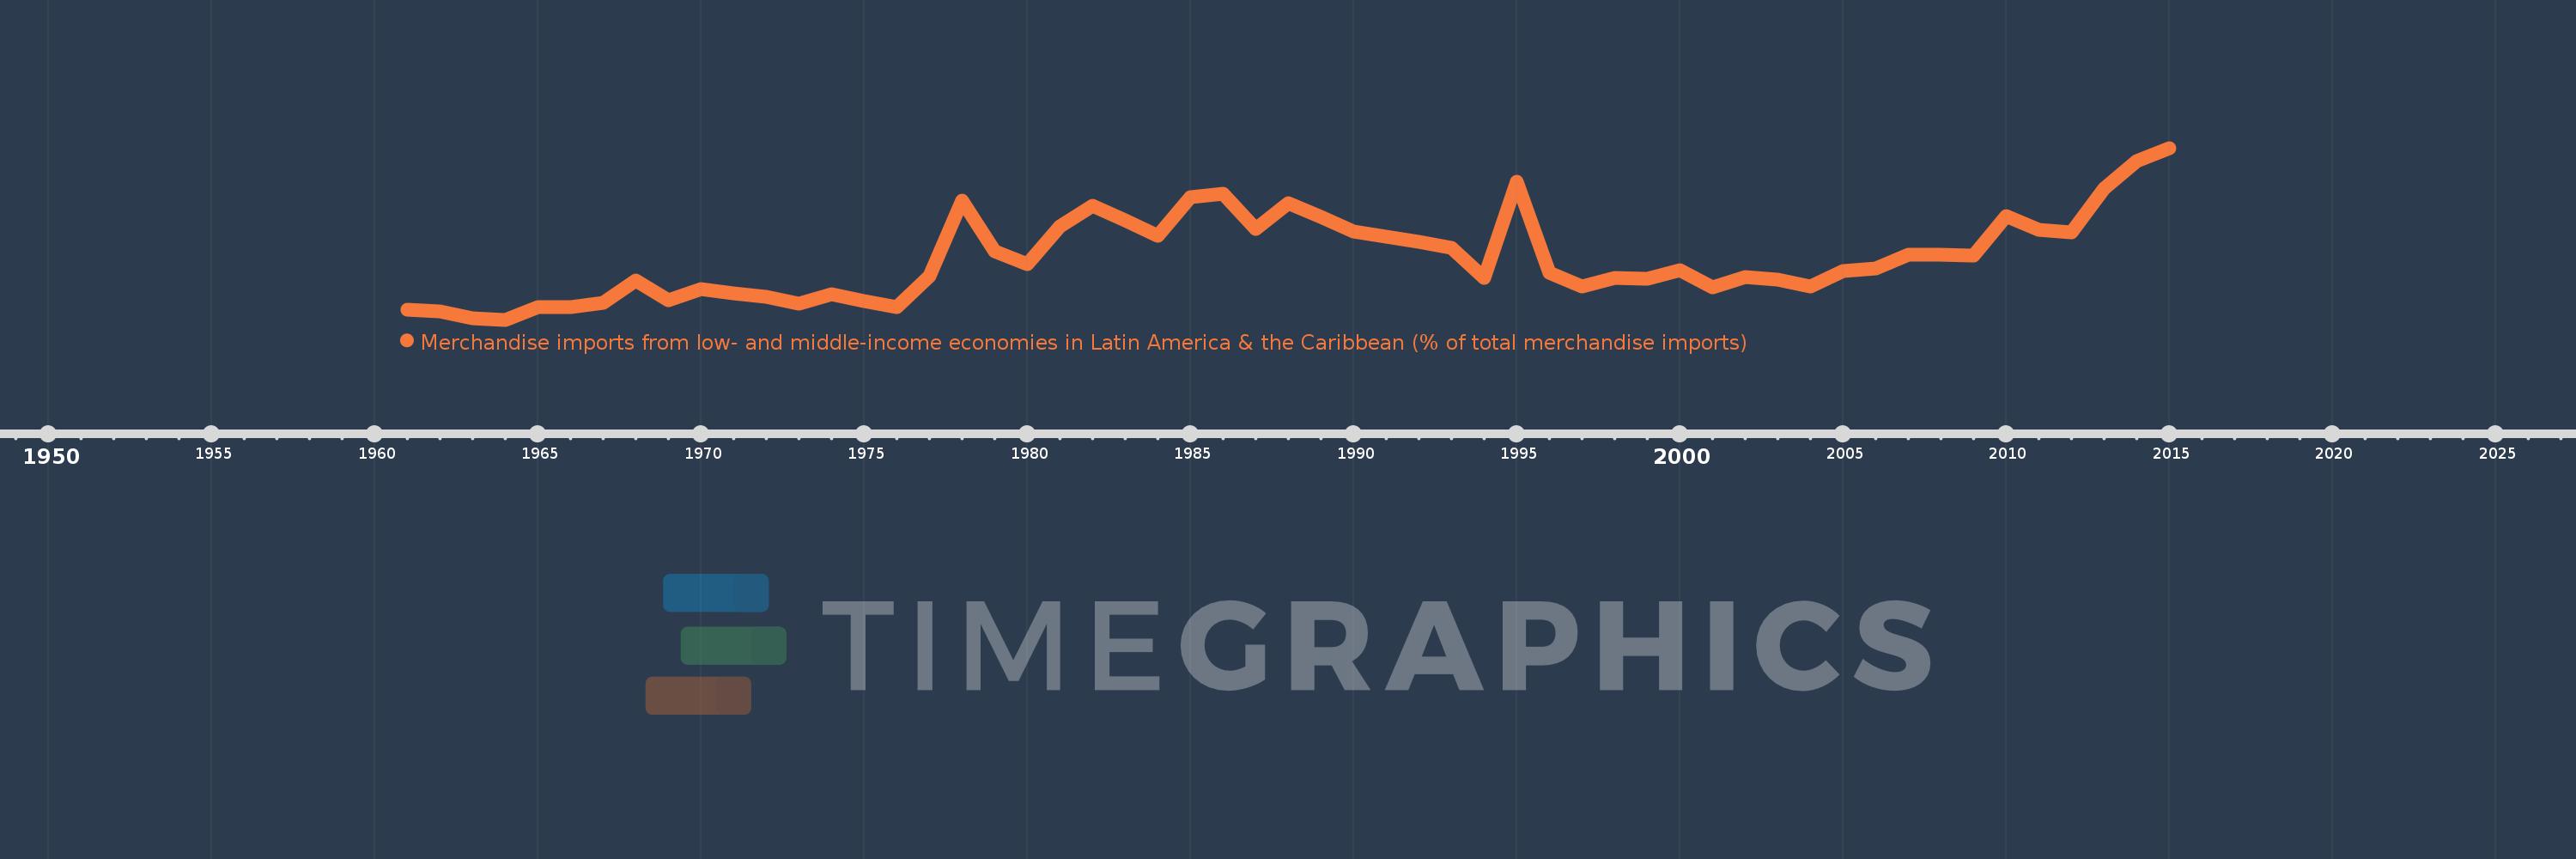
Merchandise imports from low- and middle-income economies in Latin America & the Caribbean (% of total merchandise imports)
2015,2014,2013,2012,2011,2010,2009,2008,2007,2006,2005,2004,2003,2002,2001,2000,1999,1998,1997,1996,1995,1994,1993,1992,1991,1990,1989,1988,1987,1986,1985,1984,1983,1982,1981,1980,1979,1978,1977,1976,1975,1974,1973,1972,1971,1970,1969,1968,1967,1966,1965,1964,1963,1962,1961
Global statistics library →India →Merchandise imports from low- and middle-income economies in Latin America & the Caribbean (% of total merchandise imports)
This statistics in other country:
AfghanistanAlbaniaAlgeriaAngolaAntigua and BarbudaArab WorldArgentinaArmeniaArubaAustraliaAustriaAzerbaijanBahamas, TheBahrainBangladeshBarbadosBelarusBelgiumBelizeBeninBermudaBoliviaBrazilBrunei DarussalamBulgariaBurkina FasoCabo VerdeCambodiaCameroonCanadaCaribbean small statesCentral African RepublicCentral Europe and the BalticsChileChinaColombiaCongo, Dem. Rep.Congo, Rep.Costa RicaCote d'IvoireCroatiaCubaCyprusCzech RepublicDenmarkDominicaDominican RepublicEarly-demographic dividendEast Asia & PacificEast Asia & Pacific (excluding high income)East Asia & Pacific (IDA & IBRD countries)EcuadorEgypt, Arab Rep.El SalvadorEstoniaEthiopiaEuro areaEurope & Central AsiaEurope & Central Asia (excluding high income)Europe & Central Asia (IDA & IBRD countries)European UnionFaroe IslandsFijiFinlandFragile and conflict affected situationsFranceFrench PolynesiaGabonGambia, TheGeorgiaGermanyGhanaGibraltarGreeceGreenlandGrenadaGuatemalaGuineaGuyanaHaitiHeavily indebted poor countries (HIPC)High incomeHondurasHong Kong SAR, ChinaHungaryIBRD onlyIcelandIDA & IBRD totalIDA blendIDA onlyIDA totalIndiaIndonesiaIran, Islamic Rep.IraqIrelandIsraelItalyJamaicaJapanJordanKazakhstanKenyaKorea, Dem. People’s Rep.Korea, Rep.KuwaitKyrgyz RepublicLate-demographic dividendLatin America & Caribbean Latin America & Caribbean (excluding high income)Latin America & the Caribbean (IDA & IBRD countries)LatviaLeast developed countries: UN classificationLebanonLiberiaLibyaLithuaniaLow & middle incomeLow incomeLower middle incomeLuxembourgMacao SAR, ChinaMacedonia, FYRMadagascarMalawiMalaysiaMaldivesMaliMaltaMauritaniaMauritiusMexicoMiddle East & North AfricaMiddle East & North Africa (excluding high income)Middle East & North Africa (IDA & IBRD countries)Middle incomeMoldovaMongoliaMontenegroMoroccoMozambiqueNetherlandsNew CaledoniaNew ZealandNicaraguaNigerNigeriaNorth AmericaNorwayOECD membersOmanOther small statesPacific island small statesPakistanPanamaPapua New GuineaParaguayPeruPhilippinesPolandPortugalPost-demographic dividendPre-demographic dividendQatarRomaniaRussian FederationSaudi ArabiaSenegalSerbiaSierra LeoneSingaporeSlovak RepublicSloveniaSmall statesSomaliaSouth AfricaSouth AsiaSouth Asia (IDA & IBRD)SpainSri LankaSt. Kitts and NevisSt. LuciaSt. Vincent and the GrenadinesSub-Saharan Africa Sub-Saharan Africa (excluding high income)Sub-Saharan Africa (IDA & IBRD countries)SudanSurinameSwedenSwitzerlandSyrian Arab RepublicTanzaniaThailandTogoTrinidad and TobagoTunisiaTurkeyUgandaUkraineUnited Arab EmiratesUnited KingdomUnited StatesUpper middle incomeUruguayVenezuela, RBVietnamWorldYemen, Rep.ZambiaZimbabwe Timeline:
This timeline shows a graph from 1961 to 2015 of India. No data until 1960. Number of actual observations by date: 55.
Source name:
World Development Indicators
Source organization:
World Bank staff estimates based data from International Monetary Fund's Direction of Trade database.
Categories, topics:
Private Sector, Trade
Last updated:
apr 23, 2017
Indicators value changes by year
At the date of observation
Value
Absolute change
Change from previous value
jan 1, 1961
0.231
+0.231
0.0%
jan 1, 1962
0.19
-0.041
-17.91%
jan 1, 1963
0.078
-0.112
-58.96%
jan 1, 1964
0.045
-0.033
-42.09%
jan 1, 1965
0.282
+0.237
524.86%
jan 1, 1966
0.27
-0.011
-4.03%
jan 1, 1967
0.359
+0.088
32.64%
jan 1, 1968
0.76
+0.401
111.72%
jan 1, 1969
0.398
-0.362
-47.6%
jan 1, 1970
0.602
+0.204
51.26%
jan 1, 1971
0.524
-0.078
-13.01%
jan 1, 1972
0.464
-0.06
-11.48%
jan 1, 1973
0.333
-0.13
-28.11%
jan 1, 1974
0.516
+0.183
54.96%
jan 1, 1975
0.385
-0.131
-25.44%
jan 1, 1976
0.277
-0.108
-28.06%
jan 1, 1977
0.846
+0.569
205.38%
jan 1, 1978
2.224
+1.378
162.86%
jan 1, 1979
1.294
-0.93
-41.81%
jan 1, 1980
1.062
-0.232
-17.9%
jan 1, 1981
1.747
+0.684
64.42%
jan 1, 1982
2.115
+0.368
21.09%
jan 1, 1983
1.859
-0.256
-12.09%
jan 1, 1984
1.577
-0.282
-15.16%
jan 1, 1985
2.272
+0.695
44.04%
jan 1, 1986
2.349
+0.077
3.37%
jan 1, 1987
1.706
-0.642
-27.34%
jan 1, 1988
2.167
+0.461
27.01%
jan 1, 1989
1.913
-0.254
-11.74%
jan 1, 1990
1.654
-0.259
-13.53%
jan 1, 1991
1.555
-0.099
-5.99%
jan 1, 1992
1.461
-0.095
-6.08%
jan 1, 1993
1.35
-0.111
-7.58%
jan 1, 1994
0.808
-0.542
-40.14%
jan 1, 1995
2.568
+1.76
217.77%
jan 1, 1996
0.897
-1.671
-65.07%
jan 1, 1997
0.656
-0.241
-26.88%
jan 1, 1998
0.804
+0.149
22.65%
jan 1, 1999
0.791
-0.013
-1.65%
jan 1, 2000
0.949
+0.158
19.95%
jan 1, 2001
0.631
-0.318
-33.48%
jan 1, 2002
0.823
+0.192
30.45%
jan 1, 2003
0.779
-0.044
-5.32%
jan 1, 2004
0.652
-0.128
-16.4%
jan 1, 2005
0.925
+0.273
41.94%
jan 1, 2006
0.981
+0.056
6.01%
jan 1, 2007
1.237
+0.257
26.18%
jan 1, 2008
1.234
-0.003
-0.28%
jan 1, 2009
1.213
-0.021
-1.68%
jan 1, 2010
1.942
+0.729
60.09%
jan 1, 2011
1.678
-0.264
-13.57%
jan 1, 2012
1.638
-0.04
-2.41%
jan 1, 2013
2.429
+0.791
48.27%
jan 1, 2014
2.937
+0.508
20.93%
jan 1, 2015
3.176
+0.239
8.15%
Ranking of countries by current statistics by years


Comments: