29
/
en
AIzaSyAYiBZKx7MnpbEhh9jyipgxe19OcubqV5w
April 1, 2024
276904
United States
USA
true
2
1
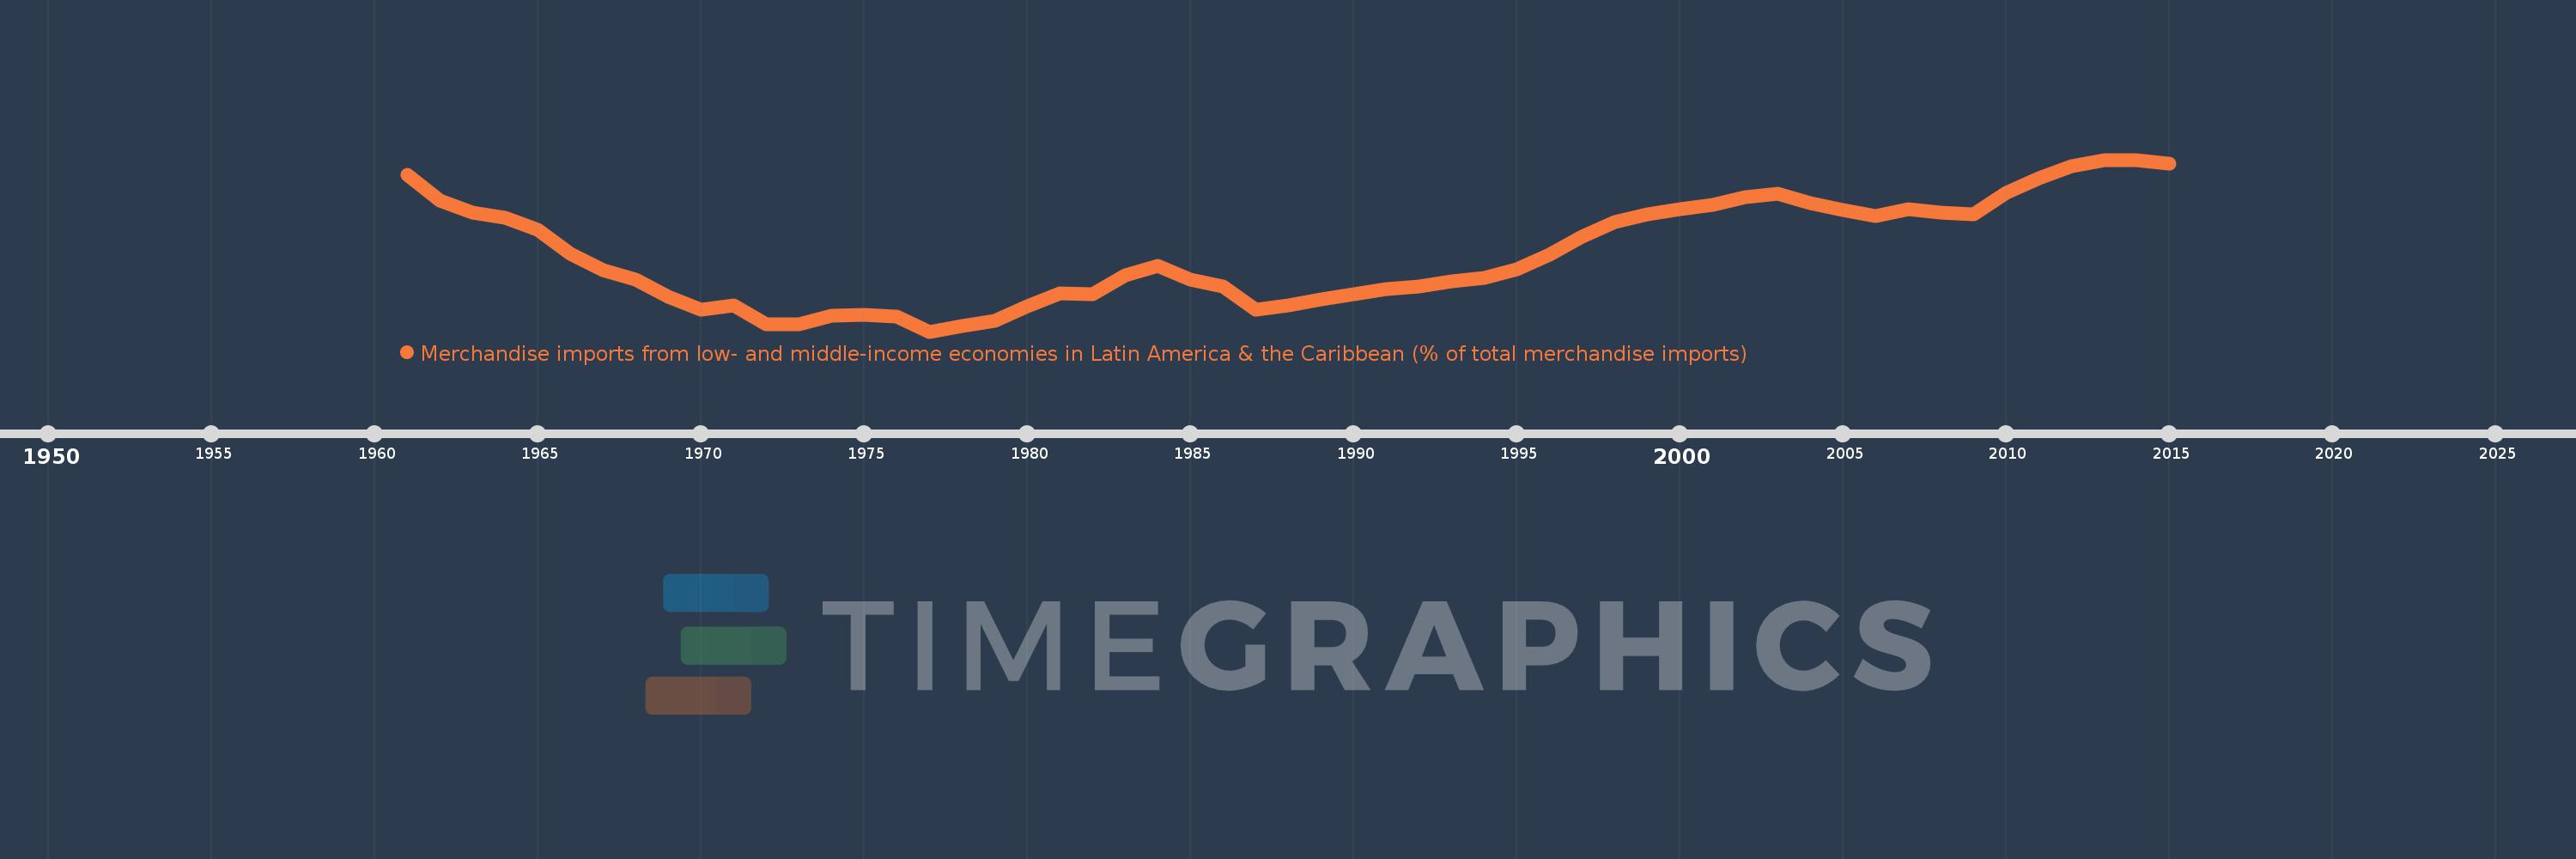
Merchandise imports from low- and middle-income economies in Latin America & the Caribbean (% of total merchandise imports)
2015,2014,2013,2012,2011,2010,2009,2008,2007,2006,2005,2004,2003,2002,2001,2000,1999,1998,1997,1996,1995,1994,1993,1992,1991,1990,1989,1988,1987,1986,1985,1984,1983,1982,1981,1980,1979,1978,1977,1976,1975,1974,1973,1972,1971,1970,1969,1968,1967,1966,1965,1964,1963,1962,1961
This statistics in other country:
AfghanistanAlbaniaAlgeriaAngolaAntigua and BarbudaArab WorldArgentinaArmeniaArubaAustraliaAustriaAzerbaijanBahamas, TheBahrainBangladeshBarbadosBelarusBelgiumBelizeBeninBermudaBoliviaBrazilBrunei DarussalamBulgariaBurkina FasoCabo VerdeCambodiaCameroonCanadaCaribbean small statesCentral African RepublicCentral Europe and the BalticsChileChinaColombiaCongo, Dem. Rep.Congo, Rep.Costa RicaCote d'IvoireCroatiaCubaCyprusCzech RepublicDenmarkDominicaDominican RepublicEarly-demographic dividendEast Asia & PacificEast Asia & Pacific (excluding high income)East Asia & Pacific (IDA & IBRD countries)EcuadorEgypt, Arab Rep.El SalvadorEstoniaEthiopiaEuro areaEurope & Central AsiaEurope & Central Asia (excluding high income)Europe & Central Asia (IDA & IBRD countries)European UnionFaroe IslandsFijiFinlandFragile and conflict affected situationsFranceFrench PolynesiaGabonGambia, TheGeorgiaGermanyGhanaGibraltarGreeceGreenlandGrenadaGuatemalaGuineaGuyanaHaitiHeavily indebted poor countries (HIPC)High incomeHondurasHong Kong SAR, ChinaHungaryIBRD onlyIcelandIDA & IBRD totalIDA blendIDA onlyIDA totalIndiaIndonesiaIran, Islamic Rep.IraqIrelandIsraelItalyJamaicaJapanJordanKazakhstanKenyaKorea, Dem. People’s Rep.Korea, Rep.KuwaitKyrgyz RepublicLate-demographic dividendLatin America & Caribbean Latin America & Caribbean (excluding high income)Latin America & the Caribbean (IDA & IBRD countries)LatviaLeast developed countries: UN classificationLebanonLiberiaLibyaLithuaniaLow & middle incomeLow incomeLower middle incomeLuxembourgMacao SAR, ChinaMacedonia, FYRMadagascarMalawiMalaysiaMaldivesMaliMaltaMauritaniaMauritiusMexicoMiddle East & North AfricaMiddle East & North Africa (excluding high income)Middle East & North Africa (IDA & IBRD countries)Middle incomeMoldovaMongoliaMontenegroMoroccoMozambiqueNetherlandsNew CaledoniaNew ZealandNicaraguaNigerNigeriaNorth AmericaNorwayOECD membersOmanOther small statesPacific island small statesPakistanPanamaPapua New GuineaParaguayPeruPhilippinesPolandPortugalPost-demographic dividendPre-demographic dividendQatarRomaniaRussian FederationSaudi ArabiaSenegalSerbiaSierra LeoneSingaporeSlovak RepublicSloveniaSmall statesSomaliaSouth AfricaSouth AsiaSouth Asia (IDA & IBRD)SpainSri LankaSt. Kitts and NevisSt. LuciaSt. Vincent and the GrenadinesSub-Saharan Africa Sub-Saharan Africa (excluding high income)Sub-Saharan Africa (IDA & IBRD countries)SudanSurinameSwedenSwitzerlandSyrian Arab RepublicTanzaniaThailandTogoTrinidad and TobagoTunisiaTurkeyUgandaUkraineUnited Arab EmiratesUnited KingdomUnited StatesUpper middle incomeUruguayVenezuela, RBVietnamWorldYemen, Rep.ZambiaZimbabwe Timeline:
This timeline shows a graph from 1961 to 2015 of United States. No data until 1960. Number of actual observations by date: 55.
Source name:
World Development Indicators
Source organization:
World Bank staff estimates based data from International Monetary Fund's Direction of Trade database.
Categories, topics:
Private Sector, Trade
Last updated:
apr 23, 2017
Indicators value changes by year
At the date of observation
Value
Absolute change
Change from previous value
jan 1, 1961
16.129
+16.129
0.0%
jan 1, 1962
14.741
-1.388
-8.61%
jan 1, 1963
14.08
-0.661
-4.48%
jan 1, 1964
13.79
-0.29
-2.06%
jan 1, 1965
13.138
-0.651
-4.72%
jan 1, 1966
11.835
-1.303
-9.92%
jan 1, 1967
10.965
-0.87
-7.35%
jan 1, 1968
10.441
-0.524
-4.78%
jan 1, 1969
9.515
-0.926
-8.87%
jan 1, 1970
8.858
-0.658
-6.91%
jan 1, 1971
9.08
+0.222
2.51%
jan 1, 1972
8.023
-1.057
-11.64%
jan 1, 1973
8.051
+0.028
0.35%
jan 1, 1974
8.511
+0.46
5.71%
jan 1, 1975
8.534
+0.024
0.28%
jan 1, 1976
8.457
-0.077
-0.9%
jan 1, 1977
7.649
-0.809
-9.56%
jan 1, 1978
7.953
+0.305
3.98%
jan 1, 1979
8.221
+0.268
3.37%
jan 1, 1980
9.035
+0.814
9.9%
jan 1, 1981
9.737
+0.702
7.77%
jan 1, 1982
9.676
-0.061
-0.63%
jan 1, 1983
10.704
+1.028
10.62%
jan 1, 1984
11.193
+0.489
4.57%
jan 1, 1985
10.444
-0.749
-6.7%
jan 1, 1986
10.099
-0.345
-3.3%
jan 1, 1987
8.846
-1.253
-12.41%
jan 1, 1988
9.074
+0.229
2.58%
jan 1, 1989
9.38
+0.306
3.37%
jan 1, 1990
9.682
+0.301
3.21%
jan 1, 1991
9.964
+0.282
2.92%
jan 1, 1992
10.105
+0.141
1.42%
jan 1, 1993
10.384
+0.278
2.75%
jan 1, 1994
10.535
+0.152
1.46%
jan 1, 1995
11.034
+0.499
4.73%
jan 1, 1996
11.831
+0.797
7.22%
jan 1, 1997
12.772
+0.941
7.96%
jan 1, 1998
13.557
+0.785
6.15%
jan 1, 1999
13.982
+0.425
3.13%
jan 1, 2000
14.294
+0.311
2.23%
jan 1, 2001
14.531
+0.237
1.66%
jan 1, 2002
14.923
+0.392
2.7%
jan 1, 2003
15.105
+0.182
1.22%
jan 1, 2004
14.597
-0.508
-3.36%
jan 1, 2005
14.238
-0.359
-2.46%
jan 1, 2006
13.891
-0.348
-2.44%
jan 1, 2007
14.276
+0.385
2.77%
jan 1, 2008
14.098
-0.177
-1.24%
jan 1, 2009
13.977
-0.121
-0.86%
jan 1, 2010
15.175
+1.198
8.57%
jan 1, 2011
15.941
+0.766
5.05%
jan 1, 2012
16.587
+0.646
4.05%
jan 1, 2013
16.95
+0.364
2.19%
jan 1, 2014
16.917
-0.034
-0.2%
jan 1, 2015
16.742
-0.174
-1.03%
Ranking of countries by current statistics by years


Comments: