29
/
en
AIzaSyAYiBZKx7MnpbEhh9jyipgxe19OcubqV5w
April 1, 2024
25912
Central Europe and the Baltics
CEB
false
2
1
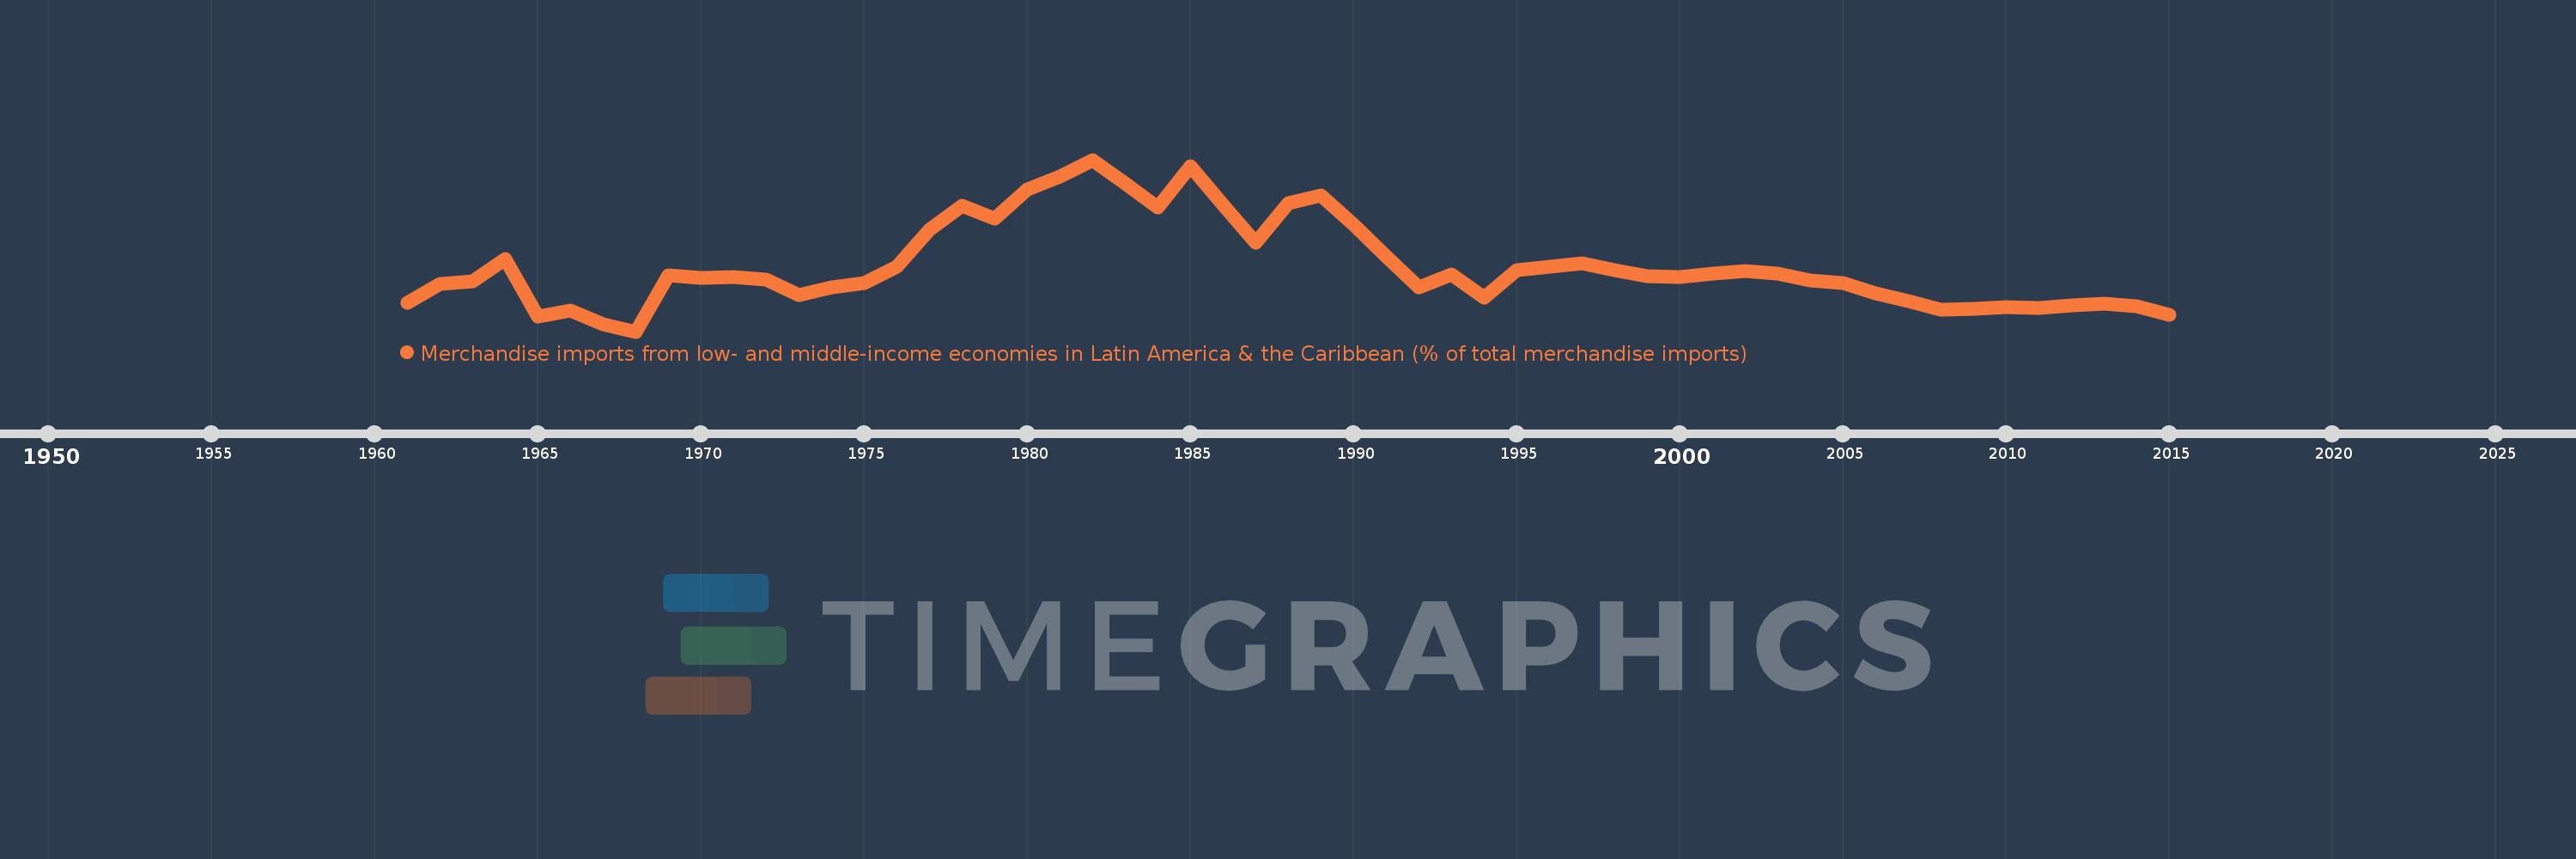
Merchandise imports from low- and middle-income economies in Latin America & the Caribbean (% of total merchandise imports)
2015,2014,2013,2012,2011,2010,2009,2008,2007,2006,2005,2004,2003,2002,2001,2000,1999,1998,1997,1996,1995,1994,1993,1992,1991,1990,1989,1988,1987,1986,1985,1984,1983,1982,1981,1980,1979,1978,1977,1976,1975,1974,1973,1972,1971,1970,1969,1968,1967,1966,1965,1964,1963,1962,1961
This statistics in other country:
AfghanistanAlbaniaAlgeriaAngolaAntigua and BarbudaArab WorldArgentinaArmeniaArubaAustraliaAustriaAzerbaijanBahamas, TheBahrainBangladeshBarbadosBelarusBelgiumBelizeBeninBermudaBoliviaBrazilBrunei DarussalamBulgariaBurkina FasoCabo VerdeCambodiaCameroonCanadaCaribbean small statesCentral African RepublicCentral Europe and the BalticsChileChinaColombiaCongo, Dem. Rep.Congo, Rep.Costa RicaCote d'IvoireCroatiaCubaCyprusCzech RepublicDenmarkDominicaDominican RepublicEarly-demographic dividendEast Asia & PacificEast Asia & Pacific (excluding high income)East Asia & Pacific (IDA & IBRD countries)EcuadorEgypt, Arab Rep.El SalvadorEstoniaEthiopiaEuro areaEurope & Central AsiaEurope & Central Asia (excluding high income)Europe & Central Asia (IDA & IBRD countries)European UnionFaroe IslandsFijiFinlandFragile and conflict affected situationsFranceFrench PolynesiaGabonGambia, TheGeorgiaGermanyGhanaGibraltarGreeceGreenlandGrenadaGuatemalaGuineaGuyanaHaitiHeavily indebted poor countries (HIPC)High incomeHondurasHong Kong SAR, ChinaHungaryIBRD onlyIcelandIDA & IBRD totalIDA blendIDA onlyIDA totalIndiaIndonesiaIran, Islamic Rep.IraqIrelandIsraelItalyJamaicaJapanJordanKazakhstanKenyaKorea, Dem. People’s Rep.Korea, Rep.KuwaitKyrgyz RepublicLate-demographic dividendLatin America & Caribbean Latin America & Caribbean (excluding high income)Latin America & the Caribbean (IDA & IBRD countries)LatviaLeast developed countries: UN classificationLebanonLiberiaLibyaLithuaniaLow & middle incomeLow incomeLower middle incomeLuxembourgMacao SAR, ChinaMacedonia, FYRMadagascarMalawiMalaysiaMaldivesMaliMaltaMauritaniaMauritiusMexicoMiddle East & North AfricaMiddle East & North Africa (excluding high income)Middle East & North Africa (IDA & IBRD countries)Middle incomeMoldovaMongoliaMontenegroMoroccoMozambiqueNetherlandsNew CaledoniaNew ZealandNicaraguaNigerNigeriaNorth AmericaNorwayOECD membersOmanOther small statesPacific island small statesPakistanPanamaPapua New GuineaParaguayPeruPhilippinesPolandPortugalPost-demographic dividendPre-demographic dividendQatarRomaniaRussian FederationSaudi ArabiaSenegalSerbiaSierra LeoneSingaporeSlovak RepublicSloveniaSmall statesSomaliaSouth AfricaSouth AsiaSouth Asia (IDA & IBRD)SpainSri LankaSt. Kitts and NevisSt. LuciaSt. Vincent and the GrenadinesSub-Saharan Africa Sub-Saharan Africa (excluding high income)Sub-Saharan Africa (IDA & IBRD countries)SudanSurinameSwedenSwitzerlandSyrian Arab RepublicTanzaniaThailandTogoTrinidad and TobagoTunisiaTurkeyUgandaUkraineUnited Arab EmiratesUnited KingdomUnited StatesUpper middle incomeUruguayVenezuela, RBVietnamWorldYemen, Rep.ZambiaZimbabwe Timeline:
This timeline shows a graph from 1961 to 2015 of Central Europe and the Baltics. No data until 1960. Number of actual observations by date: 55.
Source name:
World Development Indicators
Source organization:
World Bank staff estimates based data from International Monetary Fund's Direction of Trade database.
Categories, topics:
Private Sector, Trade
Last updated:
apr 23, 2017
Indicators value changes by year
At the date of observation
Value
Absolute change
Change from previous value
jan 1, 1961
0.609
+0.609
0.0%
jan 1, 1962
0.906
+0.297
48.87%
jan 1, 1963
0.952
+0.045
5.02%
jan 1, 1964
1.306
+0.354
37.25%
jan 1, 1965
0.388
-0.918
-70.32%
jan 1, 1966
0.474
+0.087
22.38%
jan 1, 1967
0.258
-0.216
-45.5%
jan 1, 1968
0.145
-0.114
-44.05%
jan 1, 1969
1.037
+0.892
617.11%
jan 1, 1970
1.005
-0.032
-3.07%
jan 1, 1971
1.009
+0.004
0.39%
jan 1, 1972
0.978
-0.032
-3.12%
jan 1, 1973
0.732
-0.246
-25.13%
jan 1, 1974
0.847
+0.115
15.67%
jan 1, 1975
0.919
+0.072
8.53%
jan 1, 1976
1.178
+0.259
28.22%
jan 1, 1977
1.761
+0.583
49.46%
jan 1, 1978
2.145
+0.384
21.79%
jan 1, 1979
1.947
-0.198
-9.24%
jan 1, 1980
2.403
+0.456
23.44%
jan 1, 1981
2.62
+0.217
9.02%
jan 1, 1982
2.881
+0.261
9.98%
jan 1, 1983
2.507
-0.374
-12.98%
jan 1, 1984
2.118
-0.389
-15.52%
jan 1, 1985
2.785
+0.667
31.47%
jan 1, 1986
2.161
-0.624
-22.41%
jan 1, 1987
1.567
-0.594
-27.5%
jan 1, 1988
2.197
+0.63
40.23%
jan 1, 1989
2.309
+0.112
5.08%
jan 1, 1990
1.846
-0.463
-20.05%
jan 1, 1991
1.344
-0.501
-27.17%
jan 1, 1992
0.847
-0.497
-36.96%
jan 1, 1993
1.057
+0.21
24.79%
jan 1, 1994
0.68
-0.378
-35.74%
jan 1, 1995
1.124
+0.445
65.47%
jan 1, 1996
1.181
+0.056
5.0%
jan 1, 1997
1.228
+0.047
4.0%
jan 1, 1998
1.124
-0.104
-8.44%
jan 1, 1999
1.031
-0.093
-8.26%
jan 1, 2000
1.016
-0.015
-1.44%
jan 1, 2001
1.065
+0.048
4.76%
jan 1, 2002
1.112
+0.047
4.4%
jan 1, 2003
1.064
-0.048
-4.29%
jan 1, 2004
0.963
-0.101
-9.5%
jan 1, 2005
0.924
-0.039
-4.04%
jan 1, 2006
0.76
-0.164
-17.76%
jan 1, 2007
0.626
-0.134
-17.68%
jan 1, 2008
0.491
-0.135
-21.58%
jan 1, 2009
0.51
+0.019
3.91%
jan 1, 2010
0.532
+0.022
4.32%
jan 1, 2011
0.516
-0.016
-2.97%
jan 1, 2012
0.557
+0.041
7.95%
jan 1, 2013
0.59
+0.033
5.88%
jan 1, 2014
0.547
-0.043
-7.21%
jan 1, 2015
0.417
-0.13
-23.78%
Ranking of countries by current statistics by years


Comments: