29
/
en
AIzaSyAYiBZKx7MnpbEhh9jyipgxe19OcubqV5w
April 1, 2024
236059
Senegal
SEN
true
2
1
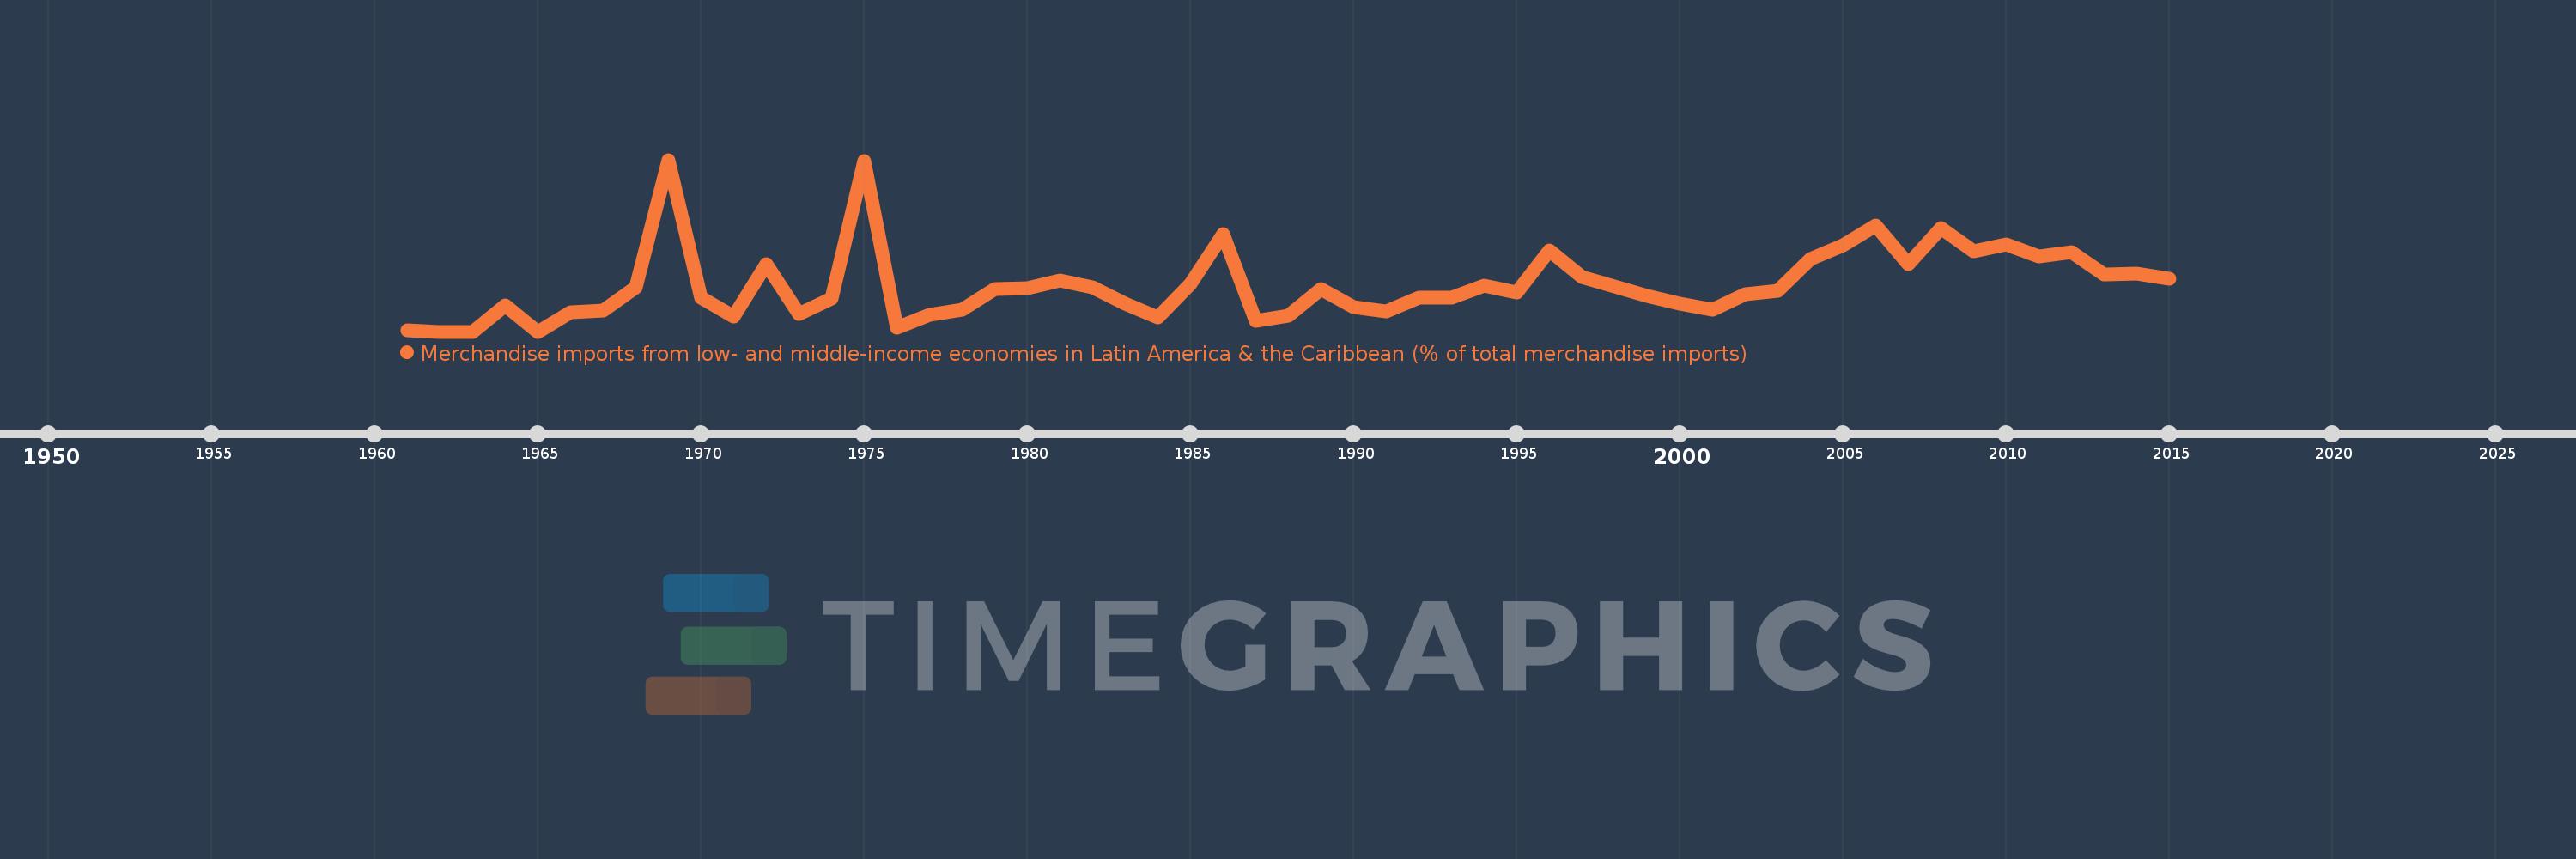
Merchandise imports from low- and middle-income economies in Latin America & the Caribbean (% of total merchandise imports)
2015,2014,2013,2012,2011,2010,2009,2008,2007,2006,2005,2004,2003,2002,2001,2000,1999,1998,1997,1996,1995,1994,1993,1992,1991,1990,1989,1988,1987,1986,1985,1984,1983,1982,1981,1980,1979,1978,1977,1976,1975,1974,1973,1972,1971,1970,1969,1968,1967,1966,1965,1964,1963,1962,1961
This statistics in other country:
AfghanistanAlbaniaAlgeriaAngolaAntigua and BarbudaArab WorldArgentinaArmeniaArubaAustraliaAustriaAzerbaijanBahamas, TheBahrainBangladeshBarbadosBelarusBelgiumBelizeBeninBermudaBoliviaBrazilBrunei DarussalamBulgariaBurkina FasoCabo VerdeCambodiaCameroonCanadaCaribbean small statesCentral African RepublicCentral Europe and the BalticsChileChinaColombiaCongo, Dem. Rep.Congo, Rep.Costa RicaCote d'IvoireCroatiaCubaCyprusCzech RepublicDenmarkDominicaDominican RepublicEarly-demographic dividendEast Asia & PacificEast Asia & Pacific (excluding high income)East Asia & Pacific (IDA & IBRD countries)EcuadorEgypt, Arab Rep.El SalvadorEstoniaEthiopiaEuro areaEurope & Central AsiaEurope & Central Asia (excluding high income)Europe & Central Asia (IDA & IBRD countries)European UnionFaroe IslandsFijiFinlandFragile and conflict affected situationsFranceFrench PolynesiaGabonGambia, TheGeorgiaGermanyGhanaGibraltarGreeceGreenlandGrenadaGuatemalaGuineaGuyanaHaitiHeavily indebted poor countries (HIPC)High incomeHondurasHong Kong SAR, ChinaHungaryIBRD onlyIcelandIDA & IBRD totalIDA blendIDA onlyIDA totalIndiaIndonesiaIran, Islamic Rep.IraqIrelandIsraelItalyJamaicaJapanJordanKazakhstanKenyaKorea, Dem. People’s Rep.Korea, Rep.KuwaitKyrgyz RepublicLate-demographic dividendLatin America & Caribbean Latin America & Caribbean (excluding high income)Latin America & the Caribbean (IDA & IBRD countries)LatviaLeast developed countries: UN classificationLebanonLiberiaLibyaLithuaniaLow & middle incomeLow incomeLower middle incomeLuxembourgMacao SAR, ChinaMacedonia, FYRMadagascarMalawiMalaysiaMaldivesMaliMaltaMauritaniaMauritiusMexicoMiddle East & North AfricaMiddle East & North Africa (excluding high income)Middle East & North Africa (IDA & IBRD countries)Middle incomeMoldovaMongoliaMontenegroMoroccoMozambiqueNetherlandsNew CaledoniaNew ZealandNicaraguaNigerNigeriaNorth AmericaNorwayOECD membersOmanOther small statesPacific island small statesPakistanPanamaPapua New GuineaParaguayPeruPhilippinesPolandPortugalPost-demographic dividendPre-demographic dividendQatarRomaniaRussian FederationSaudi ArabiaSenegalSerbiaSierra LeoneSingaporeSlovak RepublicSloveniaSmall statesSomaliaSouth AfricaSouth AsiaSouth Asia (IDA & IBRD)SpainSri LankaSt. Kitts and NevisSt. LuciaSt. Vincent and the GrenadinesSub-Saharan Africa Sub-Saharan Africa (excluding high income)Sub-Saharan Africa (IDA & IBRD countries)SudanSurinameSwedenSwitzerlandSyrian Arab RepublicTanzaniaThailandTogoTrinidad and TobagoTunisiaTurkeyUgandaUkraineUnited Arab EmiratesUnited KingdomUnited StatesUpper middle incomeUruguayVenezuela, RBVietnamWorldYemen, Rep.ZambiaZimbabwe Timeline:
This timeline shows a graph from 1961 to 2015 of Senegal. No data until 1960. Number of actual observations by date: 55.
Source name:
World Development Indicators
Source organization:
World Bank staff estimates based data from International Monetary Fund's Direction of Trade database.
Categories, topics:
Private Sector, Trade
Last updated:
apr 23, 2017
Indicators value changes by year
At the date of observation
Value
Absolute change
Change from previous value
jan 1, 1961
0.058
+0.058
0.0%
jan 1, 1962
0.0
-0.058
-100.0%
jan 1, 1964
1.187
+1.187
%
jan 1, 1965
0.0
-1.187
-100.0%
jan 1, 1966
0.855
+0.855
%
jan 1, 1967
0.968
+0.113
13.23%
jan 1, 1968
1.98
+1.012
104.61%
jan 1, 1969
7.752
+5.772
291.51%
jan 1, 1970
1.53
-6.222
-80.26%
jan 1, 1971
0.693
-0.837
-54.72%
jan 1, 1972
3.036
+2.343
338.23%
jan 1, 1973
0.807
-2.229
-73.43%
jan 1, 1974
1.504
+0.698
86.48%
jan 1, 1975
7.696
+6.192
411.58%
jan 1, 1976
0.159
-7.537
-97.94%
jan 1, 1977
0.773
+0.614
386.55%
jan 1, 1978
0.973
+0.2
25.89%
jan 1, 1979
1.925
+0.951
97.73%
jan 1, 1980
1.947
+0.023
1.19%
jan 1, 1981
2.293
+0.345
17.73%
jan 1, 1982
2.013
-0.28
-12.22%
jan 1, 1983
1.265
-0.748
-37.15%
jan 1, 1984
0.629
-0.636
-50.3%
jan 1, 1985
2.162
+1.533
243.83%
jan 1, 1986
4.411
+2.249
104.03%
jan 1, 1987
0.501
-3.91
-88.64%
jan 1, 1988
0.725
+0.224
44.68%
jan 1, 1989
1.915
+1.19
164.18%
jan 1, 1990
1.111
-0.804
-41.99%
jan 1, 1991
0.923
-0.188
-16.95%
jan 1, 1992
1.513
+0.59
63.99%
jan 1, 1993
1.521
+0.007
0.49%
jan 1, 1994
2.069
+0.549
36.09%
jan 1, 1995
1.769
-0.3
-14.51%
jan 1, 1996
3.658
+1.889
106.77%
jan 1, 1997
2.461
-1.197
-32.73%
jan 1, 1998
2.021
-0.44
-17.86%
jan 1, 1999
1.595
-0.426
-21.08%
jan 1, 2000
1.27
-0.325
-20.38%
jan 1, 2001
1.002
-0.268
-21.1%
jan 1, 2002
1.679
+0.677
67.6%
jan 1, 2003
1.848
+0.169
10.07%
jan 1, 2004
3.262
+1.414
76.48%
jan 1, 2005
3.903
+0.641
19.65%
jan 1, 2006
4.775
+0.871
22.33%
jan 1, 2007
3.045
-1.73
-36.23%
jan 1, 2008
4.67
+1.625
53.39%
jan 1, 2009
3.624
-1.047
-22.41%
jan 1, 2010
3.936
+0.312
8.61%
jan 1, 2011
3.394
-0.542
-13.77%
jan 1, 2012
3.587
+0.193
5.7%
jan 1, 2013
2.571
-1.016
-28.32%
jan 1, 2014
2.62
+0.048
1.88%
jan 1, 2015
2.388
-0.232
-8.85%
Ranking of countries by current statistics by years


Comments: