29
/
en
AIzaSyAYiBZKx7MnpbEhh9jyipgxe19OcubqV5w
April 1, 2024
52057
North America
NAC
false
2
1
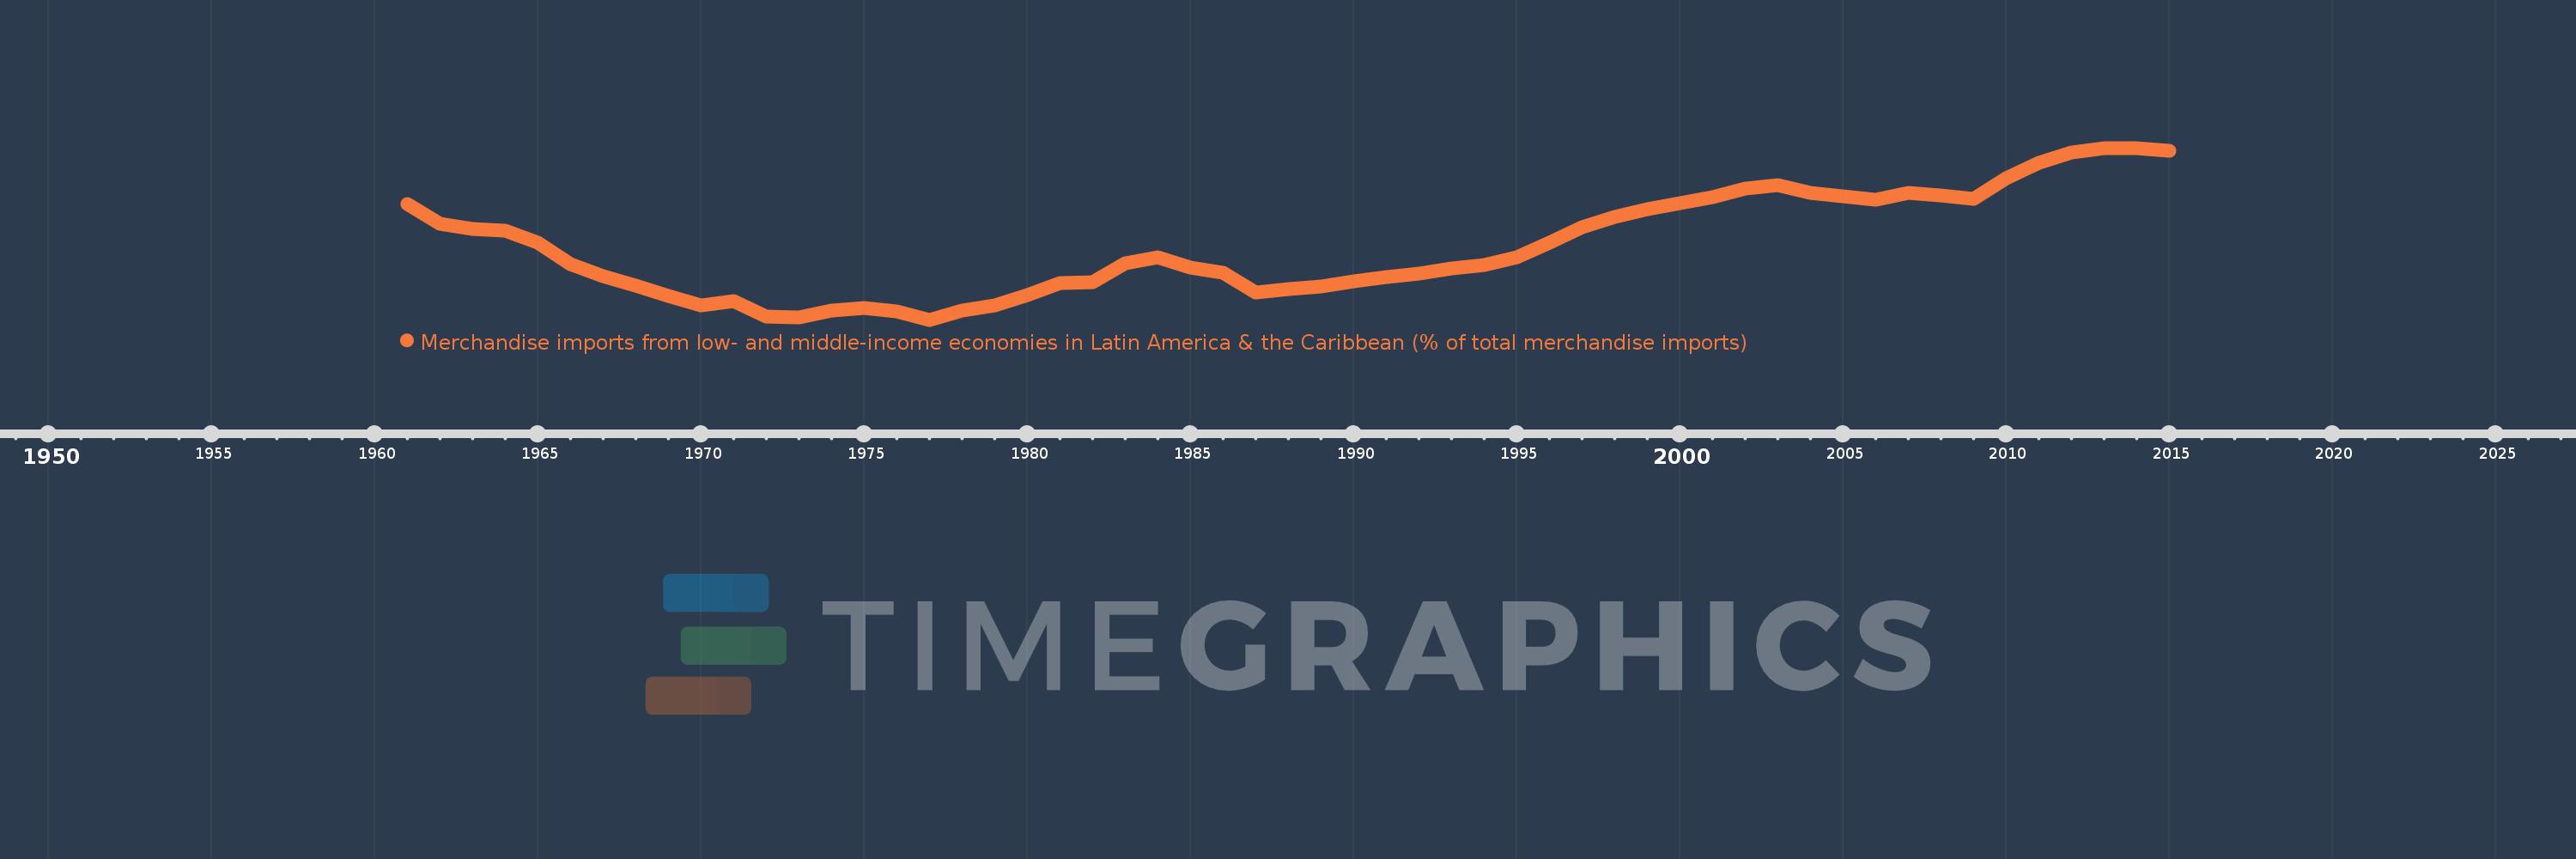
Merchandise imports from low- and middle-income economies in Latin America & the Caribbean (% of total merchandise imports)
2015,2014,2013,2012,2011,2010,2009,2008,2007,2006,2005,2004,2003,2002,2001,2000,1999,1998,1997,1996,1995,1994,1993,1992,1991,1990,1989,1988,1987,1986,1985,1984,1983,1982,1981,1980,1979,1978,1977,1976,1975,1974,1973,1972,1971,1970,1969,1968,1967,1966,1965,1964,1963,1962,1961
This statistics in other country:
AfghanistanAlbaniaAlgeriaAngolaAntigua and BarbudaArab WorldArgentinaArmeniaArubaAustraliaAustriaAzerbaijanBahamas, TheBahrainBangladeshBarbadosBelarusBelgiumBelizeBeninBermudaBoliviaBrazilBrunei DarussalamBulgariaBurkina FasoCabo VerdeCambodiaCameroonCanadaCaribbean small statesCentral African RepublicCentral Europe and the BalticsChileChinaColombiaCongo, Dem. Rep.Congo, Rep.Costa RicaCote d'IvoireCroatiaCubaCyprusCzech RepublicDenmarkDominicaDominican RepublicEarly-demographic dividendEast Asia & PacificEast Asia & Pacific (excluding high income)East Asia & Pacific (IDA & IBRD countries)EcuadorEgypt, Arab Rep.El SalvadorEstoniaEthiopiaEuro areaEurope & Central AsiaEurope & Central Asia (excluding high income)Europe & Central Asia (IDA & IBRD countries)European UnionFaroe IslandsFijiFinlandFragile and conflict affected situationsFranceFrench PolynesiaGabonGambia, TheGeorgiaGermanyGhanaGibraltarGreeceGreenlandGrenadaGuatemalaGuineaGuyanaHaitiHeavily indebted poor countries (HIPC)High incomeHondurasHong Kong SAR, ChinaHungaryIBRD onlyIcelandIDA & IBRD totalIDA blendIDA onlyIDA totalIndiaIndonesiaIran, Islamic Rep.IraqIrelandIsraelItalyJamaicaJapanJordanKazakhstanKenyaKorea, Dem. People’s Rep.Korea, Rep.KuwaitKyrgyz RepublicLate-demographic dividendLatin America & Caribbean Latin America & Caribbean (excluding high income)Latin America & the Caribbean (IDA & IBRD countries)LatviaLeast developed countries: UN classificationLebanonLiberiaLibyaLithuaniaLow & middle incomeLow incomeLower middle incomeLuxembourgMacao SAR, ChinaMacedonia, FYRMadagascarMalawiMalaysiaMaldivesMaliMaltaMauritaniaMauritiusMexicoMiddle East & North AfricaMiddle East & North Africa (excluding high income)Middle East & North Africa (IDA & IBRD countries)Middle incomeMoldovaMongoliaMontenegroMoroccoMozambiqueNetherlandsNew CaledoniaNew ZealandNicaraguaNigerNigeriaNorth AmericaNorwayOECD membersOmanOther small statesPacific island small statesPakistanPanamaPapua New GuineaParaguayPeruPhilippinesPolandPortugalPost-demographic dividendPre-demographic dividendQatarRomaniaRussian FederationSaudi ArabiaSenegalSerbiaSierra LeoneSingaporeSlovak RepublicSloveniaSmall statesSomaliaSouth AfricaSouth AsiaSouth Asia (IDA & IBRD)SpainSri LankaSt. Kitts and NevisSt. LuciaSt. Vincent and the GrenadinesSub-Saharan Africa Sub-Saharan Africa (excluding high income)Sub-Saharan Africa (IDA & IBRD countries)SudanSurinameSwedenSwitzerlandSyrian Arab RepublicTanzaniaThailandTogoTrinidad and TobagoTunisiaTurkeyUgandaUkraineUnited Arab EmiratesUnited KingdomUnited StatesUpper middle incomeUruguayVenezuela, RBVietnamWorldYemen, Rep.ZambiaZimbabwe Timeline:
This timeline shows a graph from 1961 to 2015 of North America. No data until 1960. Number of actual observations by date: 55.
Source name:
World Development Indicators
Source organization:
World Bank staff estimates based data from International Monetary Fund's Direction of Trade database.
Categories, topics:
Private Sector, Trade
Last updated:
apr 23, 2017
Indicators value changes by year
Maximum:
15.326
jan 1, 2013
At the date of observation
Value
Absolute change
Change from previous value
jan 1, 1961
12.318
+12.318
0.0%
jan 1, 1962
11.265
-1.054
-8.55%
jan 1, 1963
10.985
-0.279
-2.48%
jan 1, 1964
10.932
-0.054
-0.49%
jan 1, 1965
10.284
-0.648
-5.93%
jan 1, 1966
9.128
-1.156
-11.24%
jan 1, 1967
8.466
-0.662
-7.26%
jan 1, 1968
7.957
-0.509
-6.01%
jan 1, 1969
7.439
-0.518
-6.5%
jan 1, 1970
6.908
-0.532
-7.15%
jan 1, 1971
7.167
+0.26
3.76%
jan 1, 1972
6.322
-0.845
-11.79%
jan 1, 1973
6.291
-0.031
-0.49%
jan 1, 1974
6.666
+0.375
5.97%
jan 1, 1975
6.781
+0.114
1.71%
jan 1, 1976
6.595
-0.185
-2.73%
jan 1, 1977
6.157
-0.438
-6.64%
jan 1, 1978
6.635
+0.477
7.75%
jan 1, 1979
6.904
+0.269
4.06%
jan 1, 1980
7.459
+0.555
8.03%
jan 1, 1981
8.128
+0.669
8.98%
jan 1, 1982
8.157
+0.029
0.36%
jan 1, 1983
9.177
+1.02
12.51%
jan 1, 1984
9.505
+0.328
3.57%
jan 1, 1985
8.944
-0.561
-5.9%
jan 1, 1986
8.646
-0.298
-3.33%
jan 1, 1987
7.614
-1.032
-11.94%
jan 1, 1988
7.783
+0.169
2.22%
jan 1, 1989
7.942
+0.158
2.03%
jan 1, 1990
8.229
+0.288
3.62%
jan 1, 1991
8.449
+0.219
2.66%
jan 1, 1992
8.629
+0.18
2.13%
jan 1, 1993
8.9
+0.272
3.15%
jan 1, 1994
9.06
+0.16
1.79%
jan 1, 1995
9.512
+0.452
4.99%
jan 1, 1996
10.263
+0.751
7.9%
jan 1, 1997
11.099
+0.836
8.14%
jan 1, 1998
11.666
+0.568
5.11%
jan 1, 1999
12.049
+0.382
3.28%
jan 1, 2000
12.379
+0.33
2.74%
jan 1, 2001
12.711
+0.332
2.68%
jan 1, 2002
13.135
+0.425
3.34%
jan 1, 2003
13.334
+0.199
1.51%
jan 1, 2004
12.936
-0.398
-2.98%
jan 1, 2005
12.761
-0.175
-1.36%
jan 1, 2006
12.541
-0.22
-1.73%
jan 1, 2007
12.929
+0.389
3.1%
jan 1, 2008
12.773
-0.156
-1.21%
jan 1, 2009
12.624
-0.149
-1.17%
jan 1, 2010
13.702
+1.078
8.54%
jan 1, 2011
14.531
+0.829
6.05%
jan 1, 2012
15.066
+0.535
3.68%
jan 1, 2013
15.326
+0.26
1.73%
jan 1, 2014
15.304
-0.022
-0.14%
jan 1, 2015
15.195
-0.109
-0.71%
Ranking of countries by current statistics by years


Comments: