29
/
en
AIzaSyAYiBZKx7MnpbEhh9jyipgxe19OcubqV5w
April 1, 2024
262549
Thailand
THA
true
2
1
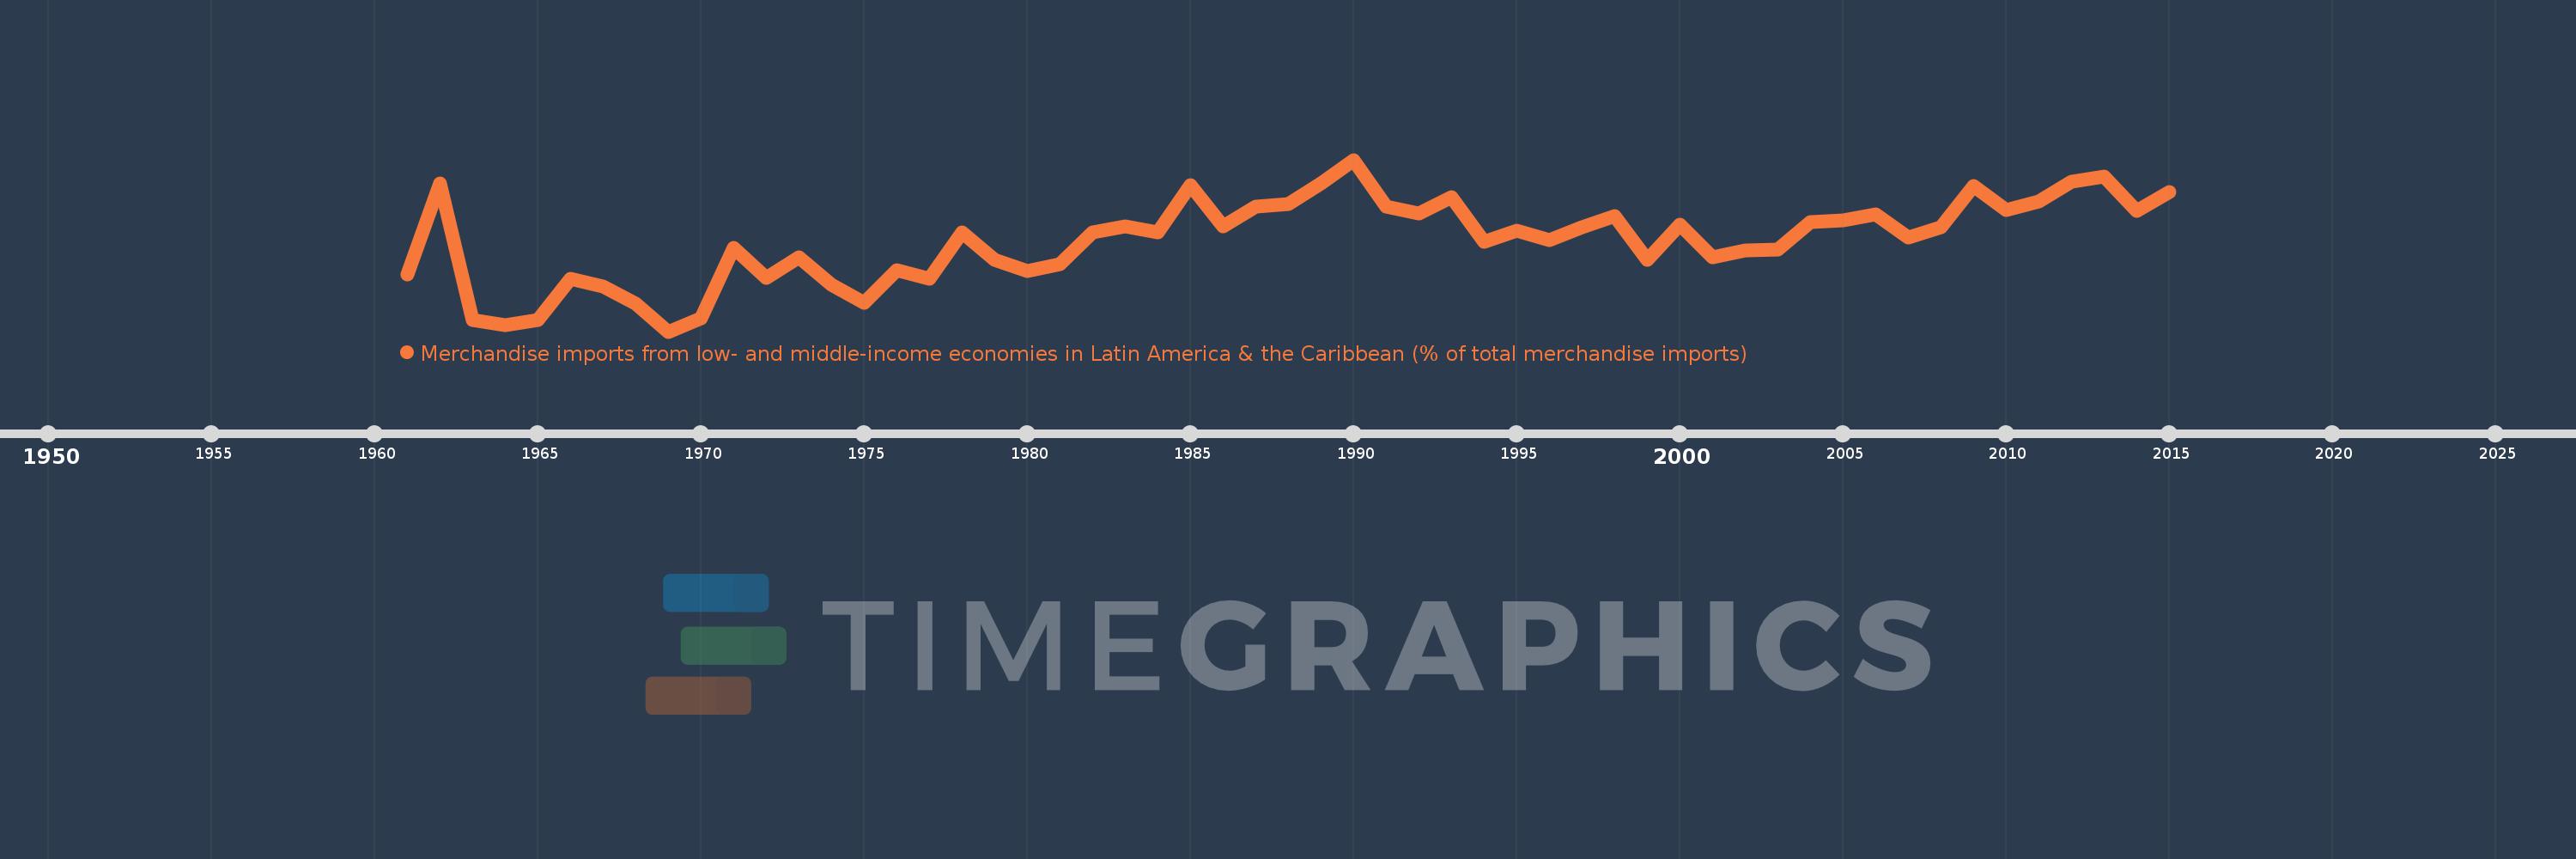
Merchandise imports from low- and middle-income economies in Latin America & the Caribbean (% of total merchandise imports)
2015,2014,2013,2012,2011,2010,2009,2008,2007,2006,2005,2004,2003,2002,2001,2000,1999,1998,1997,1996,1995,1994,1993,1992,1991,1990,1989,1988,1987,1986,1985,1984,1983,1982,1981,1980,1979,1978,1977,1976,1975,1974,1973,1972,1971,1970,1969,1968,1967,1966,1965,1964,1963,1962,1961
This statistics in other country:
AfghanistanAlbaniaAlgeriaAngolaAntigua and BarbudaArab WorldArgentinaArmeniaArubaAustraliaAustriaAzerbaijanBahamas, TheBahrainBangladeshBarbadosBelarusBelgiumBelizeBeninBermudaBoliviaBrazilBrunei DarussalamBulgariaBurkina FasoCabo VerdeCambodiaCameroonCanadaCaribbean small statesCentral African RepublicCentral Europe and the BalticsChileChinaColombiaCongo, Dem. Rep.Congo, Rep.Costa RicaCote d'IvoireCroatiaCubaCyprusCzech RepublicDenmarkDominicaDominican RepublicEarly-demographic dividendEast Asia & PacificEast Asia & Pacific (excluding high income)East Asia & Pacific (IDA & IBRD countries)EcuadorEgypt, Arab Rep.El SalvadorEstoniaEthiopiaEuro areaEurope & Central AsiaEurope & Central Asia (excluding high income)Europe & Central Asia (IDA & IBRD countries)European UnionFaroe IslandsFijiFinlandFragile and conflict affected situationsFranceFrench PolynesiaGabonGambia, TheGeorgiaGermanyGhanaGibraltarGreeceGreenlandGrenadaGuatemalaGuineaGuyanaHaitiHeavily indebted poor countries (HIPC)High incomeHondurasHong Kong SAR, ChinaHungaryIBRD onlyIcelandIDA & IBRD totalIDA blendIDA onlyIDA totalIndiaIndonesiaIran, Islamic Rep.IraqIrelandIsraelItalyJamaicaJapanJordanKazakhstanKenyaKorea, Dem. People’s Rep.Korea, Rep.KuwaitKyrgyz RepublicLate-demographic dividendLatin America & Caribbean Latin America & Caribbean (excluding high income)Latin America & the Caribbean (IDA & IBRD countries)LatviaLeast developed countries: UN classificationLebanonLiberiaLibyaLithuaniaLow & middle incomeLow incomeLower middle incomeLuxembourgMacao SAR, ChinaMacedonia, FYRMadagascarMalawiMalaysiaMaldivesMaliMaltaMauritaniaMauritiusMexicoMiddle East & North AfricaMiddle East & North Africa (excluding high income)Middle East & North Africa (IDA & IBRD countries)Middle incomeMoldovaMongoliaMontenegroMoroccoMozambiqueNetherlandsNew CaledoniaNew ZealandNicaraguaNigerNigeriaNorth AmericaNorwayOECD membersOmanOther small statesPacific island small statesPakistanPanamaPapua New GuineaParaguayPeruPhilippinesPolandPortugalPost-demographic dividendPre-demographic dividendQatarRomaniaRussian FederationSaudi ArabiaSenegalSerbiaSierra LeoneSingaporeSlovak RepublicSloveniaSmall statesSomaliaSouth AfricaSouth AsiaSouth Asia (IDA & IBRD)SpainSri LankaSt. Kitts and NevisSt. LuciaSt. Vincent and the GrenadinesSub-Saharan Africa Sub-Saharan Africa (excluding high income)Sub-Saharan Africa (IDA & IBRD countries)SudanSurinameSwedenSwitzerlandSyrian Arab RepublicTanzaniaThailandTogoTrinidad and TobagoTunisiaTurkeyUgandaUkraineUnited Arab EmiratesUnited KingdomUnited StatesUpper middle incomeUruguayVenezuela, RBVietnamWorldYemen, Rep.ZambiaZimbabwe Timeline:
This timeline shows a graph from 1961 to 2015 of Thailand. No data until 1960. Number of actual observations by date: 55.
Source name:
World Development Indicators
Source organization:
World Bank staff estimates based data from International Monetary Fund's Direction of Trade database.
Categories, topics:
Private Sector, Trade
Last updated:
apr 23, 2017
Indicators value changes by year
At the date of observation
Value
Absolute change
Change from previous value
jan 1, 1961
0.622
+0.622
0.0%
jan 1, 1962
1.537
+0.915
147.08%
jan 1, 1963
0.167
-1.371
-89.16%
jan 1, 1964
0.118
-0.048
-28.97%
jan 1, 1965
0.168
+0.049
41.78%
jan 1, 1966
0.585
+0.417
248.63%
jan 1, 1967
0.502
-0.083
-14.13%
jan 1, 1968
0.331
-0.172
-34.22%
jan 1, 1969
0.053
-0.278
-84.11%
jan 1, 1970
0.188
+0.136
258.44%
jan 1, 1971
0.889
+0.701
372.48%
jan 1, 1972
0.594
-0.295
-33.21%
jan 1, 1973
0.796
+0.202
33.94%
jan 1, 1974
0.526
-0.27
-33.95%
jan 1, 1975
0.344
-0.181
-34.53%
jan 1, 1976
0.665
+0.321
93.27%
jan 1, 1977
0.581
-0.084
-12.64%
jan 1, 1978
1.049
+0.468
80.63%
jan 1, 1979
0.773
-0.276
-26.31%
jan 1, 1980
0.656
-0.117
-15.11%
jan 1, 1981
0.726
+0.069
10.54%
jan 1, 1982
1.048
+0.323
44.48%
jan 1, 1983
1.108
+0.06
5.71%
jan 1, 1984
1.047
-0.061
-5.53%
jan 1, 1985
1.517
+0.47
44.93%
jan 1, 1986
1.104
-0.413
-27.21%
jan 1, 1987
1.309
+0.204
18.5%
jan 1, 1988
1.327
+0.018
1.36%
jan 1, 1989
1.536
+0.21
15.82%
jan 1, 1990
1.774
+0.238
15.46%
jan 1, 1991
1.305
-0.469
-26.45%
jan 1, 1992
1.238
-0.067
-5.11%
jan 1, 1993
1.398
+0.16
12.95%
jan 1, 1994
0.955
-0.443
-31.71%
jan 1, 1995
1.067
+0.112
11.74%
jan 1, 1996
0.973
-0.094
-8.81%
jan 1, 1997
1.096
+0.123
12.59%
jan 1, 1998
1.211
+0.115
10.49%
jan 1, 1999
0.771
-0.439
-36.29%
jan 1, 2000
1.124
+0.353
45.72%
jan 1, 2001
0.794
-0.33
-29.32%
jan 1, 2002
0.867
+0.073
9.16%
jan 1, 2003
0.879
+0.012
1.38%
jan 1, 2004
1.147
+0.268
30.46%
jan 1, 2005
1.164
+0.017
1.47%
jan 1, 2006
1.228
+0.064
5.53%
jan 1, 2007
0.994
-0.235
-19.1%
jan 1, 2008
1.1
+0.107
10.73%
jan 1, 2009
1.511
+0.411
37.35%
jan 1, 2010
1.268
-0.243
-16.08%
jan 1, 2011
1.358
+0.09
7.11%
jan 1, 2012
1.557
+0.199
14.65%
jan 1, 2013
1.604
+0.047
2.99%
jan 1, 2014
1.258
-0.345
-21.54%
jan 1, 2015
1.453
+0.195
15.47%
Ranking of countries by current statistics by years


Comments: