29
/
en
AIzaSyAYiBZKx7MnpbEhh9jyipgxe19OcubqV5w
April 1, 2024
201870
Morocco
MAR
true
2
1
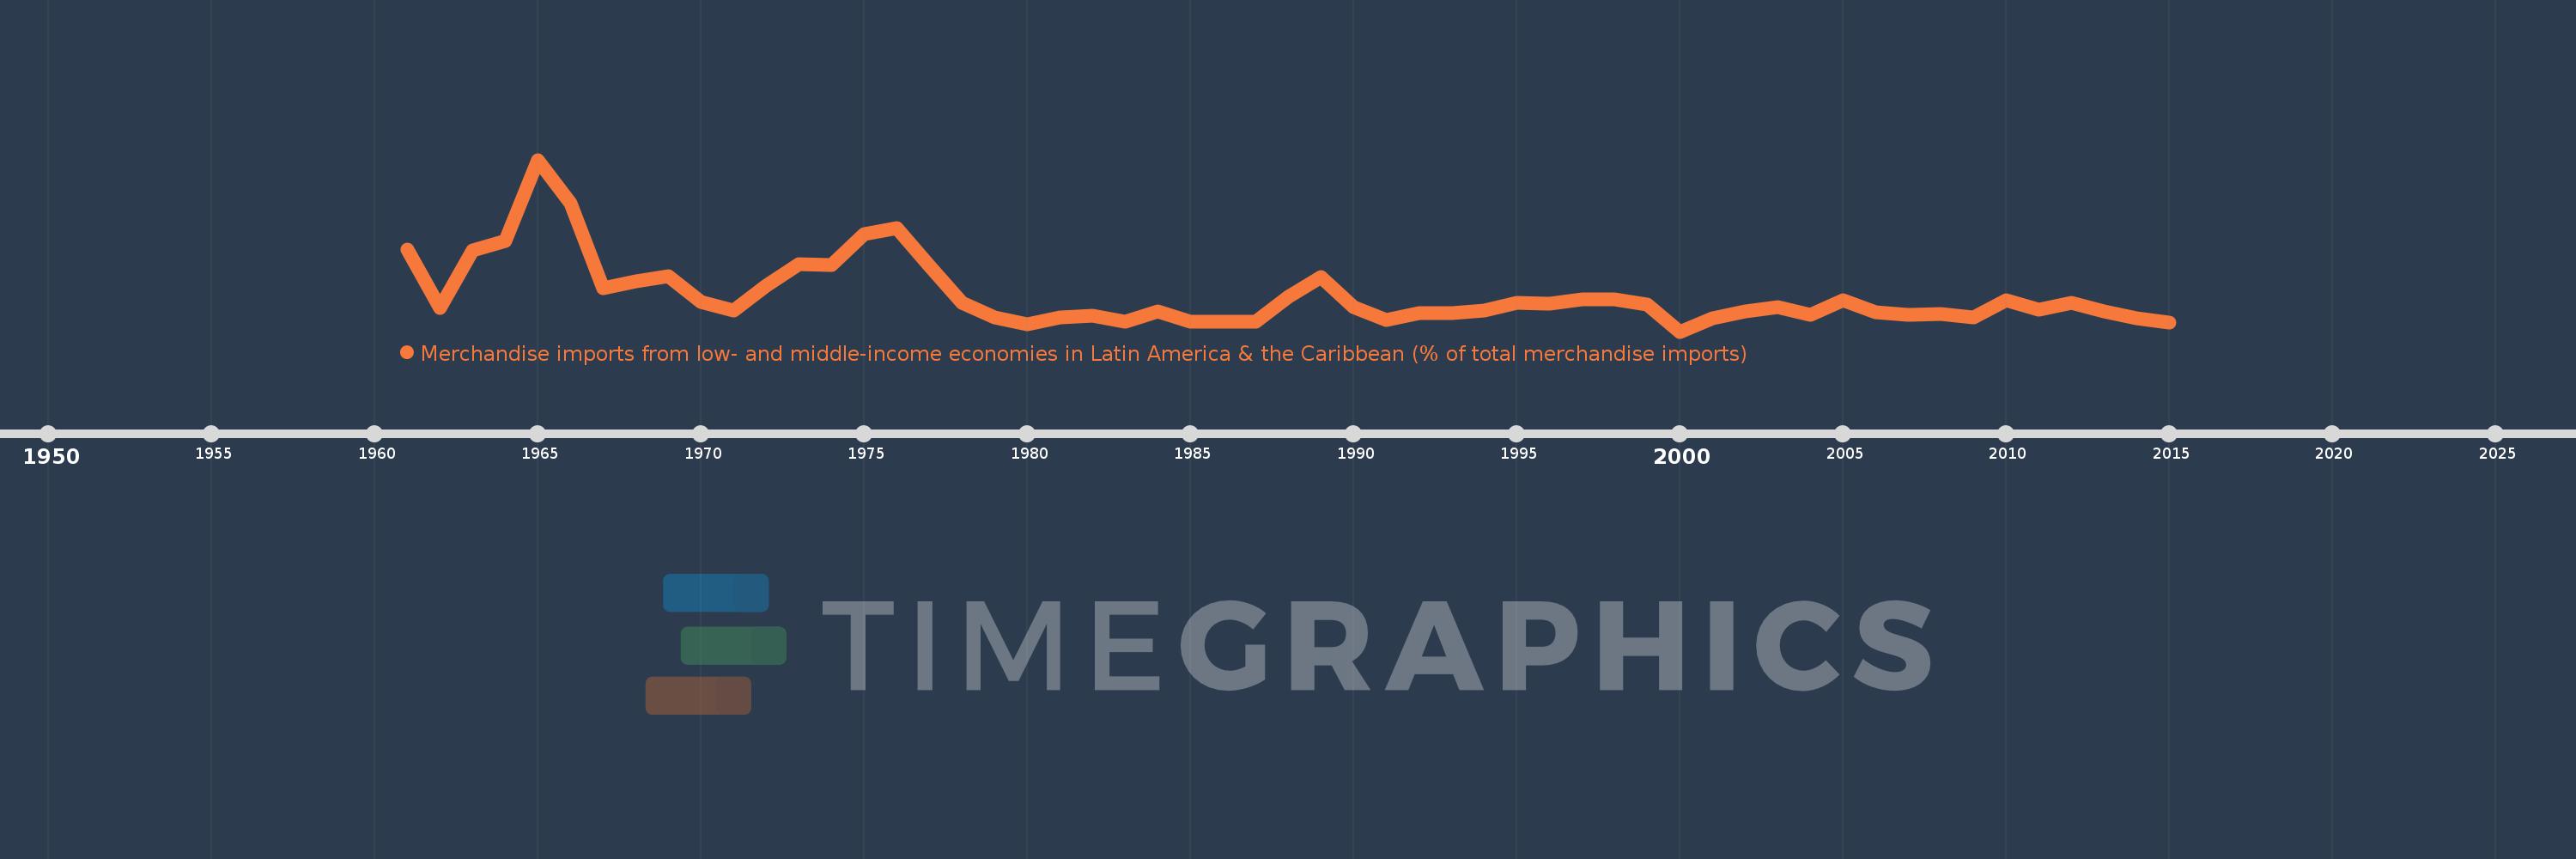
Merchandise imports from low- and middle-income economies in Latin America & the Caribbean (% of total merchandise imports)
2015,2014,2013,2012,2011,2010,2009,2008,2007,2006,2005,2004,2003,2002,2001,2000,1999,1998,1997,1996,1995,1994,1993,1992,1991,1990,1989,1988,1987,1986,1985,1984,1983,1982,1981,1980,1979,1978,1977,1976,1975,1974,1973,1972,1971,1970,1969,1968,1967,1966,1965,1964,1963,1962,1961
This statistics in other country:
AfghanistanAlbaniaAlgeriaAngolaAntigua and BarbudaArab WorldArgentinaArmeniaArubaAustraliaAustriaAzerbaijanBahamas, TheBahrainBangladeshBarbadosBelarusBelgiumBelizeBeninBermudaBoliviaBrazilBrunei DarussalamBulgariaBurkina FasoCabo VerdeCambodiaCameroonCanadaCaribbean small statesCentral African RepublicCentral Europe and the BalticsChileChinaColombiaCongo, Dem. Rep.Congo, Rep.Costa RicaCote d'IvoireCroatiaCubaCyprusCzech RepublicDenmarkDominicaDominican RepublicEarly-demographic dividendEast Asia & PacificEast Asia & Pacific (excluding high income)East Asia & Pacific (IDA & IBRD countries)EcuadorEgypt, Arab Rep.El SalvadorEstoniaEthiopiaEuro areaEurope & Central AsiaEurope & Central Asia (excluding high income)Europe & Central Asia (IDA & IBRD countries)European UnionFaroe IslandsFijiFinlandFragile and conflict affected situationsFranceFrench PolynesiaGabonGambia, TheGeorgiaGermanyGhanaGibraltarGreeceGreenlandGrenadaGuatemalaGuineaGuyanaHaitiHeavily indebted poor countries (HIPC)High incomeHondurasHong Kong SAR, ChinaHungaryIBRD onlyIcelandIDA & IBRD totalIDA blendIDA onlyIDA totalIndiaIndonesiaIran, Islamic Rep.IraqIrelandIsraelItalyJamaicaJapanJordanKazakhstanKenyaKorea, Dem. People’s Rep.Korea, Rep.KuwaitKyrgyz RepublicLate-demographic dividendLatin America & Caribbean Latin America & Caribbean (excluding high income)Latin America & the Caribbean (IDA & IBRD countries)LatviaLeast developed countries: UN classificationLebanonLiberiaLibyaLithuaniaLow & middle incomeLow incomeLower middle incomeLuxembourgMacao SAR, ChinaMacedonia, FYRMadagascarMalawiMalaysiaMaldivesMaliMaltaMauritaniaMauritiusMexicoMiddle East & North AfricaMiddle East & North Africa (excluding high income)Middle East & North Africa (IDA & IBRD countries)Middle incomeMoldovaMongoliaMontenegroMoroccoMozambiqueNetherlandsNew CaledoniaNew ZealandNicaraguaNigerNigeriaNorth AmericaNorwayOECD membersOmanOther small statesPacific island small statesPakistanPanamaPapua New GuineaParaguayPeruPhilippinesPolandPortugalPost-demographic dividendPre-demographic dividendQatarRomaniaRussian FederationSaudi ArabiaSenegalSerbiaSierra LeoneSingaporeSlovak RepublicSloveniaSmall statesSomaliaSouth AfricaSouth AsiaSouth Asia (IDA & IBRD)SpainSri LankaSt. Kitts and NevisSt. LuciaSt. Vincent and the GrenadinesSub-Saharan Africa Sub-Saharan Africa (excluding high income)Sub-Saharan Africa (IDA & IBRD countries)SudanSurinameSwedenSwitzerlandSyrian Arab RepublicTanzaniaThailandTogoTrinidad and TobagoTunisiaTurkeyUgandaUkraineUnited Arab EmiratesUnited KingdomUnited StatesUpper middle incomeUruguayVenezuela, RBVietnamWorldYemen, Rep.ZambiaZimbabwe Timeline:
This timeline shows a graph from 1961 to 2015 of Morocco. No data until 1960. Number of actual observations by date: 55.
Source name:
World Development Indicators
Source organization:
World Bank staff estimates based data from International Monetary Fund's Direction of Trade database.
Categories, topics:
Private Sector, Trade
Last updated:
apr 23, 2017
Indicators value changes by year
Maximum:
11.623
jan 1, 1965
At the date of observation
Value
Absolute change
Change from previous value
jan 1, 1961
6.247
+6.247
0.0%
jan 1, 1962
2.762
-3.485
-55.78%
jan 1, 1963
6.172
+3.41
123.46%
jan 1, 1964
6.759
+0.587
9.51%
jan 1, 1965
11.623
+4.864
71.96%
jan 1, 1966
9.002
-2.621
-22.55%
jan 1, 1967
3.945
-5.057
-56.18%
jan 1, 1968
4.326
+0.381
9.66%
jan 1, 1969
4.654
+0.328
7.58%
jan 1, 1970
3.128
-1.526
-32.79%
jan 1, 1971
2.619
-0.509
-16.26%
jan 1, 1972
4.064
+1.445
55.16%
jan 1, 1973
5.386
+1.322
32.53%
jan 1, 1974
5.329
-0.057
-1.06%
jan 1, 1975
7.183
+1.854
34.79%
jan 1, 1976
7.554
+0.37
5.16%
jan 1, 1977
5.289
-2.265
-29.98%
jan 1, 1978
3.04
-2.249
-42.53%
jan 1, 1979
2.174
-0.865
-28.47%
jan 1, 1980
1.778
-0.397
-18.24%
jan 1, 1981
2.162
+0.385
21.64%
jan 1, 1982
2.298
+0.136
6.28%
jan 1, 1983
1.926
-0.372
-16.18%
jan 1, 1984
2.534
+0.608
31.57%
jan 1, 1985
1.914
-0.62
-24.47%
jan 1, 1986
1.922
+0.008
0.43%
jan 1, 1987
1.945
+0.023
1.2%
jan 1, 1988
3.403
+1.457
74.91%
jan 1, 1989
4.59
+1.187
34.9%
jan 1, 1990
2.788
-1.802
-39.26%
jan 1, 1991
2.049
-0.739
-26.49%
jan 1, 1992
2.448
+0.398
19.44%
jan 1, 1993
2.455
+0.007
0.28%
jan 1, 1994
2.61
+0.156
6.34%
jan 1, 1995
3.058
+0.448
17.17%
jan 1, 1996
3.015
-0.043
-1.41%
jan 1, 1997
3.287
+0.272
9.02%
jan 1, 1998
3.267
-0.021
-0.63%
jan 1, 1999
2.933
-0.333
-10.21%
jan 1, 2000
1.334
-1.599
-54.52%
jan 1, 2001
2.122
+0.788
59.07%
jan 1, 2002
2.549
+0.427
20.12%
jan 1, 2003
2.788
+0.239
9.36%
jan 1, 2004
2.316
-0.471
-16.9%
jan 1, 2005
3.192
+0.875
37.79%
jan 1, 2006
2.513
-0.679
-21.26%
jan 1, 2007
2.348
-0.165
-6.58%
jan 1, 2008
2.4
+0.052
2.21%
jan 1, 2009
2.186
-0.214
-8.9%
jan 1, 2010
3.191
+1.005
45.97%
jan 1, 2011
2.624
-0.567
-17.77%
jan 1, 2012
3.046
+0.422
16.1%
jan 1, 2013
2.554
-0.492
-16.15%
jan 1, 2014
2.106
-0.448
-17.54%
jan 1, 2015
1.892
-0.214
-10.16%
Ranking of countries by current statistics by years


Comments: