29
/
en
AIzaSyAYiBZKx7MnpbEhh9jyipgxe19OcubqV5w
April 1, 2024
76283
Bahamas, The
BHS
true
2
1
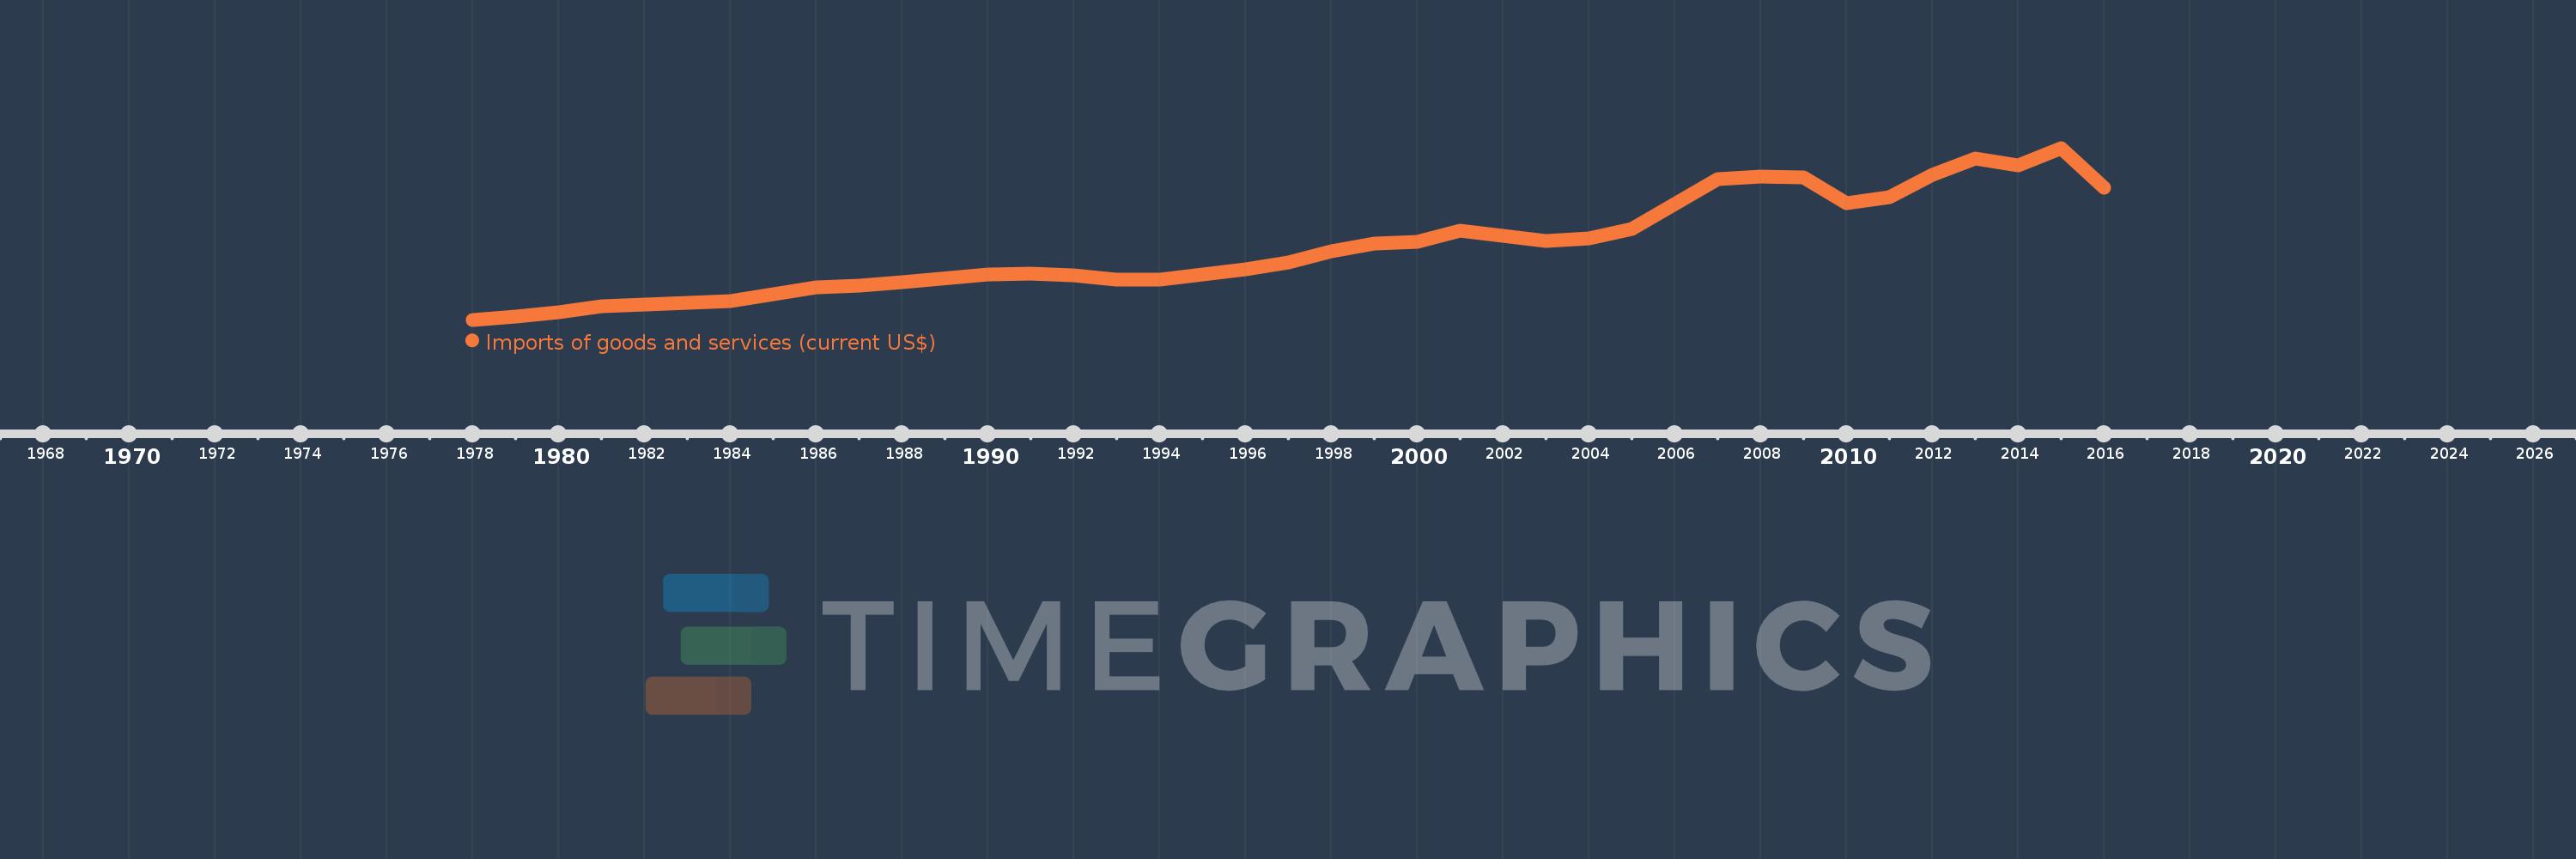
Imports of goods and services (current US$)
2016,2015,2014,2013,2012,2011,2010,2009,2008,2007,2006,2005,2004,2003,2002,2001,2000,1999,1998,1997,1996,1995,1994,1993,1992,1991,1990,1988,1987,1986,1985,1984,1983,1982,1981,1980,1979,1978
This statistics in other country:
AfghanistanAlbaniaAlgeriaAngolaAntigua and BarbudaArab WorldArgentinaArmeniaArubaAustraliaAustriaAzerbaijanBahamas, TheBahrainBangladeshBarbadosBelarusBelgiumBelizeBeninBermudaBhutanBoliviaBosnia and HerzegovinaBotswanaBrazilBrunei DarussalamBulgariaBurkina FasoBurundiCabo VerdeCambodiaCameroonCanadaCaribbean small statesCentral African RepublicCentral Europe and the BalticsChadChileChinaColombiaComorosCongo, Dem. Rep.Congo, Rep.Costa RicaCote d'IvoireCroatiaCubaCyprusCzech RepublicDenmarkDjiboutiDominicaDominican RepublicEarly-demographic dividendEast Asia & PacificEast Asia & Pacific (excluding high income)East Asia & Pacific (IDA & IBRD countries)EcuadorEgypt, Arab Rep.El SalvadorEquatorial GuineaEritreaEstoniaEthiopiaEuro areaEurope & Central AsiaEurope & Central Asia (excluding high income)Europe & Central Asia (IDA & IBRD countries)European UnionFaroe IslandsFijiFinlandFragile and conflict affected situationsFranceFrench PolynesiaGabonGambia, TheGeorgiaGermanyGhanaGreeceGrenadaGuatemalaGuineaGuinea-BissauGuyanaHaitiHeavily indebted poor countries (HIPC)High incomeHondurasHong Kong SAR, ChinaHungaryIBRD onlyIcelandIDA & IBRD totalIDA blendIDA onlyIDA totalIndiaIndonesiaIran, Islamic Rep.IraqIrelandIsraelItalyJamaicaJapanJordanKazakhstanKenyaKiribatiKorea, Rep.KosovoKuwaitKyrgyz RepublicLao PDRLate-demographic dividendLatin America & Caribbean Latin America & Caribbean (excluding high income)Latin America & the Caribbean (IDA & IBRD countries)LatviaLeast developed countries: UN classificationLebanonLesothoLiberiaLibyaLithuaniaLow & middle incomeLow incomeLower middle incomeLuxembourgMacao SAR, ChinaMacedonia, FYRMadagascarMalawiMalaysiaMaldivesMaliMaltaMauritaniaMauritiusMexicoMicronesia, Fed. Sts.Middle East & North AfricaMiddle East & North Africa (excluding high income)Middle East & North Africa (IDA & IBRD countries)Middle incomeMoldovaMongoliaMontenegroMoroccoMozambiqueMyanmarNamibiaNepalNetherlandsNew CaledoniaNew ZealandNicaraguaNigerNigeriaNorth AmericaNorwayOECD membersOmanOther small statesPacific island small statesPakistanPalauPanamaPapua New GuineaParaguayPeruPhilippinesPolandPortugalPost-demographic dividendPre-demographic dividendPuerto RicoQatarRomaniaRussian FederationRwandaSamoaSaudi ArabiaSenegalSerbiaSeychellesSierra LeoneSingaporeSlovak RepublicSloveniaSmall statesSolomon IslandsSomaliaSouth AfricaSouth AsiaSouth Asia (IDA & IBRD)South SudanSpainSri LankaSt. Kitts and NevisSt. LuciaSt. Vincent and the GrenadinesSub-Saharan Africa Sub-Saharan Africa (excluding high income)Sub-Saharan Africa (IDA & IBRD countries)SudanSurinameSwazilandSwedenSwitzerlandSyrian Arab RepublicTajikistanTanzaniaThailandTimor-LesteTogoTongaTrinidad and TobagoTunisiaTurkeyTurkmenistanUgandaUkraineUnited Arab EmiratesUnited KingdomUnited StatesUpper middle incomeUruguayUzbekistanVanuatuVenezuela, RBVietnamWest Bank and GazaWorldYemen, Rep.ZambiaZimbabwe Timeline:
This timeline shows a graph from 1978 to 2016 of Bahamas, The. No data until 1977. Number of actual observations by date: 38.
Source name:
World Development Indicators
Source organization:
World Bank national accounts data, and OECD National Accounts data files.
Categories, topics:
Economy & Growth, Trade
Last updated:
apr 23, 2017
Indicators value changes by year
Minimum:
471.6 mln
jan 1, 1978
Maximum:
5.282 bln
jan 1, 2015
At the date of observation
Value
Absolute change
Change from previous value
jan 1, 1978
471.6 mln
+471.6 mln
0.0%
jan 1, 1979
562.0 mln
+90.4 mln
19.17%
jan 1, 1980
686.2 mln
+124.2 mln
22.1%
jan 1, 1981
839.6 mln
+153.4 mln
22.35%
jan 1, 1982
889.7 mln
+50.1 mln
5.97%
jan 1, 1983
939.9 mln
+50.2 mln
5.64%
jan 1, 1984
1.005 bln
+65.4 mln
6.96%
jan 1, 1985
1.19 bln
+184.8 mln
18.38%
jan 1, 1986
1.375 bln
+185.4 mln
15.58%
jan 1, 1987
1.432 bln
+56.2 mln
4.09%
jan 1, 1988
1.514 bln
+82.8 mln
5.78%
jan 1, 1990
1.751 bln
+236.01 mln
15.58%
jan 1, 1991
1.772 bln
+21.16 mln
1.21%
jan 1, 1992
1.716 bln
-55.32 mln
-3.12%
jan 1, 1993
1.592 bln
-124.09 mln
-7.23%
jan 1, 1994
1.589 bln
-3.18 mln
-0.2%
jan 1, 1995
1.74 bln
+150.59 mln
9.48%
jan 1, 1996
1.883 bln
+143.41 mln
8.24%
jan 1, 1997
2.087 bln
+203.61 mln
10.81%
jan 1, 1998
2.394 bln
+307.58 mln
14.74%
jan 1, 1999
2.597 bln
+202.27 mln
8.45%
jan 1, 2000
2.661 bln
+64.08 mln
2.47%
jan 1, 2001
2.964 bln
+303.54 mln
11.41%
jan 1, 2002
2.82 bln
-144.06 mln
-4.86%
jan 1, 2003
2.672 bln
-147.93 mln
-5.25%
jan 1, 2004
2.759 bln
+86.7 mln
3.24%
jan 1, 2005
3.019 bln
+260.06 mln
9.43%
jan 1, 2006
3.7 bln
+681.23 mln
22.57%
jan 1, 2007
4.417 bln
+717.0 mln
19.38%
jan 1, 2008
4.489 bln
+72.23 mln
1.64%
jan 1, 2009
4.452 bln
-37.64 mln
-0.84%
jan 1, 2010
3.728 bln
-723.72 mln
-16.26%
jan 1, 2011
3.895 bln
+166.49 mln
4.47%
jan 1, 2012
4.522 bln
+627.83 mln
16.12%
jan 1, 2013
4.977 bln
+455.071 mln
10.06%
jan 1, 2014
4.794 bln
-183.457 mln
-3.69%
jan 1, 2015
5.282 bln
+488.452 mln
10.19%
jan 1, 2016
4.179 bln
-1.104 bln
-20.89%
Ranking of countries by current statistics by years


Comments: