29
/
en
AIzaSyAYiBZKx7MnpbEhh9jyipgxe19OcubqV5w
April 1, 2024
43518
Latin America & the Caribbean (IDA & IBRD countries)
TLA
false
2
1
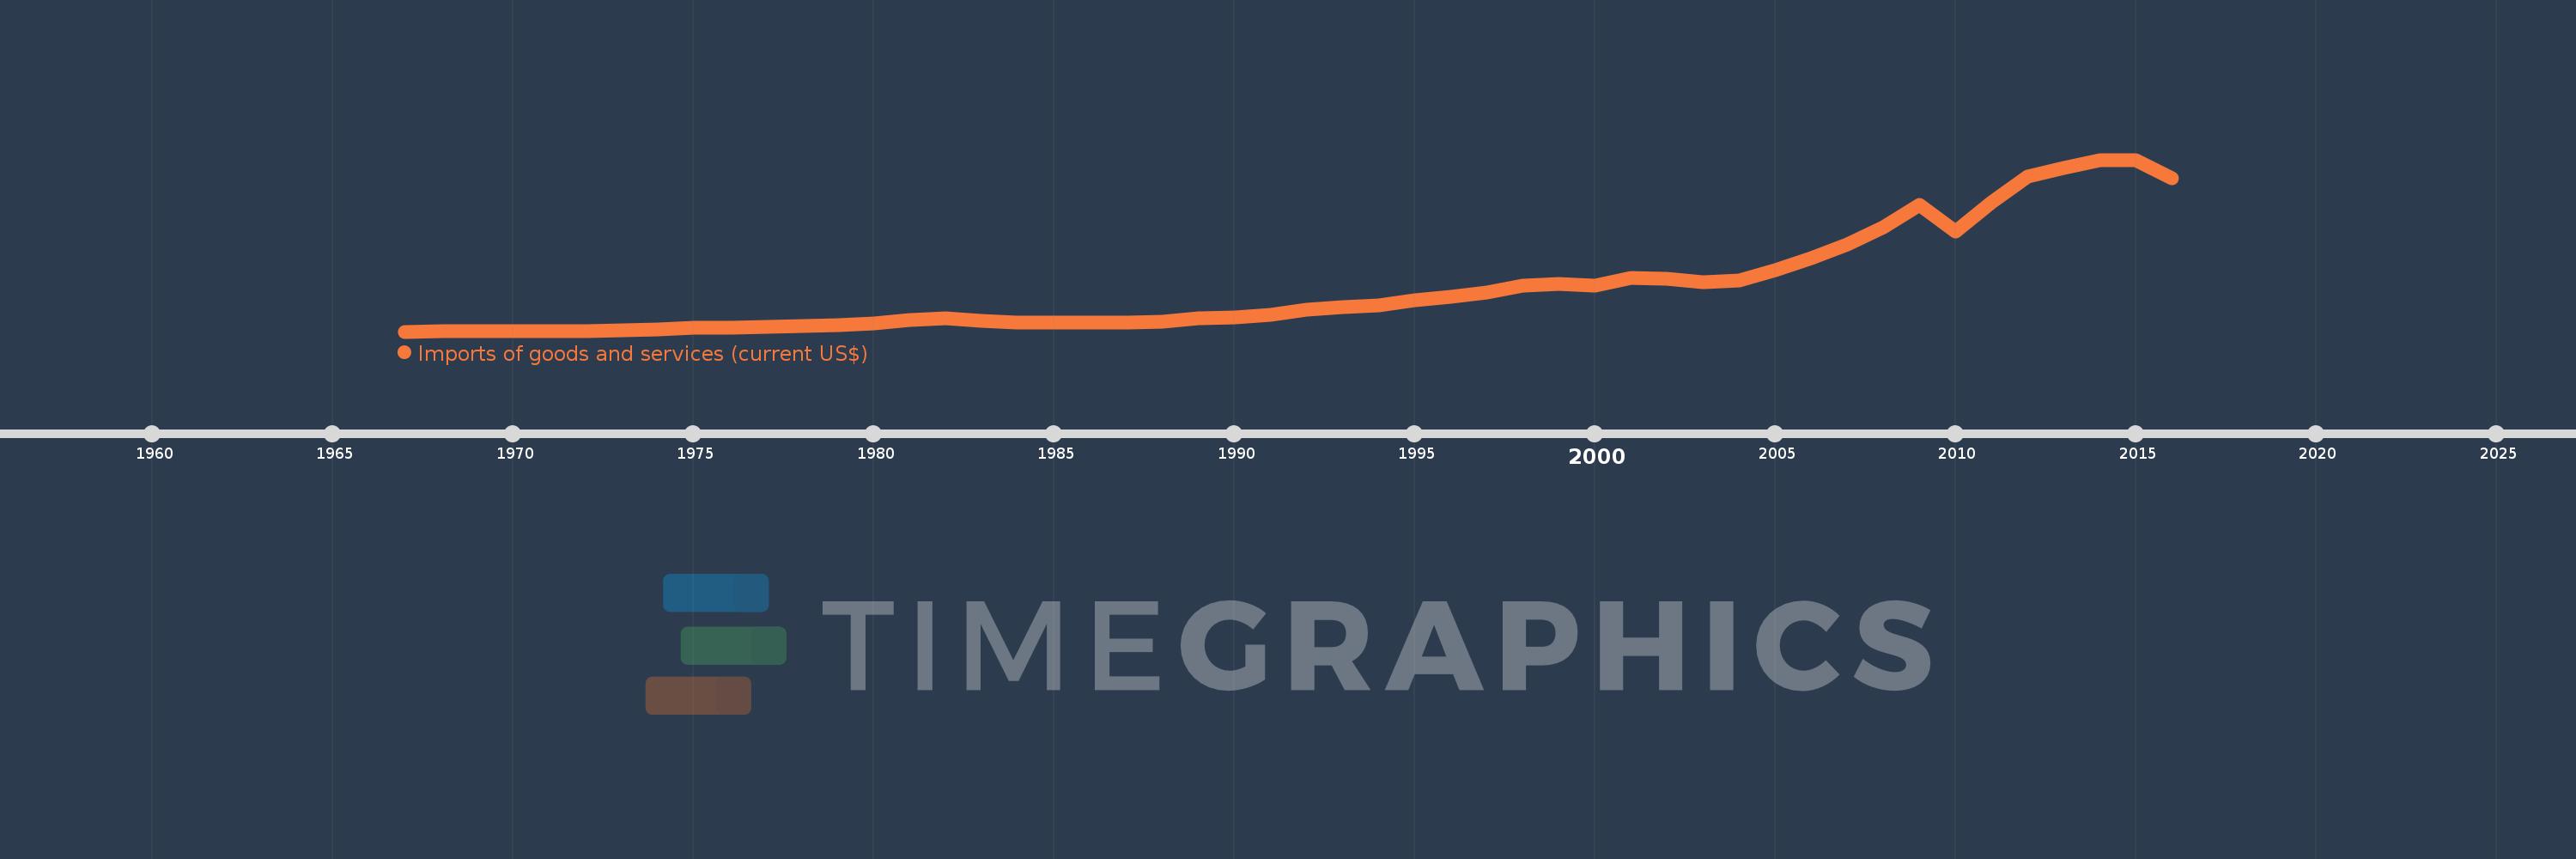
Imports of goods and services (current US$)
2016,2015,2014,2013,2012,2011,2010,2009,2008,2007,2006,2005,2004,2003,2002,2001,2000,1999,1998,1997,1996,1995,1994,1993,1992,1991,1990,1989,1988,1987,1986,1985,1984,1983,1982,1981,1980,1979,1978,1977,1976,1975,1974,1973,1972,1971,1970,1969,1968,1967
This statistics in other country:
AfghanistanAlbaniaAlgeriaAngolaAntigua and BarbudaArab WorldArgentinaArmeniaArubaAustraliaAustriaAzerbaijanBahamas, TheBahrainBangladeshBarbadosBelarusBelgiumBelizeBeninBermudaBhutanBoliviaBosnia and HerzegovinaBotswanaBrazilBrunei DarussalamBulgariaBurkina FasoBurundiCabo VerdeCambodiaCameroonCanadaCaribbean small statesCentral African RepublicCentral Europe and the BalticsChadChileChinaColombiaComorosCongo, Dem. Rep.Congo, Rep.Costa RicaCote d'IvoireCroatiaCubaCyprusCzech RepublicDenmarkDjiboutiDominicaDominican RepublicEarly-demographic dividendEast Asia & PacificEast Asia & Pacific (excluding high income)East Asia & Pacific (IDA & IBRD countries)EcuadorEgypt, Arab Rep.El SalvadorEquatorial GuineaEritreaEstoniaEthiopiaEuro areaEurope & Central AsiaEurope & Central Asia (excluding high income)Europe & Central Asia (IDA & IBRD countries)European UnionFaroe IslandsFijiFinlandFragile and conflict affected situationsFranceFrench PolynesiaGabonGambia, TheGeorgiaGermanyGhanaGreeceGrenadaGuatemalaGuineaGuinea-BissauGuyanaHaitiHeavily indebted poor countries (HIPC)High incomeHondurasHong Kong SAR, ChinaHungaryIBRD onlyIcelandIDA & IBRD totalIDA blendIDA onlyIDA totalIndiaIndonesiaIran, Islamic Rep.IraqIrelandIsraelItalyJamaicaJapanJordanKazakhstanKenyaKiribatiKorea, Rep.KosovoKuwaitKyrgyz RepublicLao PDRLate-demographic dividendLatin America & Caribbean Latin America & Caribbean (excluding high income)Latin America & the Caribbean (IDA & IBRD countries)LatviaLeast developed countries: UN classificationLebanonLesothoLiberiaLibyaLithuaniaLow & middle incomeLow incomeLower middle incomeLuxembourgMacao SAR, ChinaMacedonia, FYRMadagascarMalawiMalaysiaMaldivesMaliMaltaMauritaniaMauritiusMexicoMicronesia, Fed. Sts.Middle East & North AfricaMiddle East & North Africa (excluding high income)Middle East & North Africa (IDA & IBRD countries)Middle incomeMoldovaMongoliaMontenegroMoroccoMozambiqueMyanmarNamibiaNepalNetherlandsNew CaledoniaNew ZealandNicaraguaNigerNigeriaNorth AmericaNorwayOECD membersOmanOther small statesPacific island small statesPakistanPalauPanamaPapua New GuineaParaguayPeruPhilippinesPolandPortugalPost-demographic dividendPre-demographic dividendPuerto RicoQatarRomaniaRussian FederationRwandaSamoaSaudi ArabiaSenegalSerbiaSeychellesSierra LeoneSingaporeSlovak RepublicSloveniaSmall statesSolomon IslandsSomaliaSouth AfricaSouth AsiaSouth Asia (IDA & IBRD)South SudanSpainSri LankaSt. Kitts and NevisSt. LuciaSt. Vincent and the GrenadinesSub-Saharan Africa Sub-Saharan Africa (excluding high income)Sub-Saharan Africa (IDA & IBRD countries)SudanSurinameSwazilandSwedenSwitzerlandSyrian Arab RepublicTajikistanTanzaniaThailandTimor-LesteTogoTongaTrinidad and TobagoTunisiaTurkeyTurkmenistanUgandaUkraineUnited Arab EmiratesUnited KingdomUnited StatesUpper middle incomeUruguayUzbekistanVanuatuVenezuela, RBVietnamWest Bank and GazaWorldYemen, Rep.ZambiaZimbabwe Timeline:
This timeline shows a graph from 1967 to 2016 of Latin America & the Caribbean (IDA & IBRD countries). No data until 1966. Number of actual observations by date: 50.
Source name:
World Development Indicators
Source organization:
World Bank national accounts data, and OECD National Accounts data files.
Categories, topics:
Economy & Growth, Trade
Last updated:
apr 23, 2017
Indicators value changes by year
Minimum:
13.145 bln
jan 1, 1967
Maximum:
1.388 trl
jan 1, 2015
At the date of observation
Value
Absolute change
Change from previous value
jan 1, 1967
13.145 bln
+13.145 bln
0.0%
jan 1, 1968
13.823 bln
+678.471 mln
5.16%
jan 1, 1969
15.035 bln
+1.212 bln
8.77%
jan 1, 1970
16.403 bln
+1.368 bln
9.1%
jan 1, 1971
18.263 bln
+1.86 bln
11.34%
jan 1, 1972
19.71 bln
+1.446 bln
7.92%
jan 1, 1973
22.897 bln
+3.187 bln
16.17%
jan 1, 1974
29.216 bln
+6.319 bln
27.6%
jan 1, 1975
43.334 bln
+14.118 bln
48.32%
jan 1, 1976
46.228 bln
+2.894 bln
6.68%
jan 1, 1977
50.32 bln
+4.092 bln
8.85%
jan 1, 1978
59.701 bln
+9.381 bln
18.64%
jan 1, 1979
67.133 bln
+7.432 bln
12.45%
jan 1, 1980
80.878 bln
+13.745 bln
20.47%
jan 1, 1981
103.693 bln
+22.815 bln
28.21%
jan 1, 1982
119.644 bln
+15.951 bln
15.38%
jan 1, 1983
99.103 bln
-20.541 bln
-17.17%
jan 1, 1984
83.809 bln
-15.294 bln
-15.43%
jan 1, 1985
84.196 bln
+386.678 mln
0.46%
jan 1, 1986
84.384 bln
+187.735 mln
0.22%
jan 1, 1987
86.845 bln
+2.462 bln
2.92%
jan 1, 1988
93.338 bln
+6.492 bln
7.48%
jan 1, 1989
116.995 bln
+23.657 bln
25.35%
jan 1, 1990
124.188 bln
+7.193 bln
6.15%
jan 1, 1991
149.309 bln
+25.121 bln
20.23%
jan 1, 1992
189.244 bln
+39.935 bln
26.75%
jan 1, 1993
208.104 bln
+18.86 bln
9.97%
jan 1, 1994
221.449 bln
+13.346 bln
6.41%
jan 1, 1995
266.548 bln
+45.098 bln
20.37%
jan 1, 1996
291.078 bln
+24.53 bln
9.2%
jan 1, 1997
325.712 bln
+34.634 bln
11.9%
jan 1, 1998
380.021 bln
+54.309 bln
16.67%
jan 1, 1999
397.088 bln
+17.066 bln
4.49%
jan 1, 2000
379.002 bln
-18.085 bln
-4.55%
jan 1, 2001
441.77 bln
+62.768 bln
16.56%
jan 1, 2002
438.273 bln
-3.497 bln
-0.79%
jan 1, 2003
407.729 bln
-30.544 bln
-6.97%
jan 1, 2004
425.191 bln
+17.461 bln
4.28%
jan 1, 2005
507.455 bln
+82.265 bln
19.35%
jan 1, 2006
600.068 bln
+92.613 bln
18.25%
jan 1, 2007
708.021 bln
+107.953 bln
17.99%
jan 1, 2008
845.167 bln
+137.146 bln
19.37%
jan 1, 2009
1.026 trl
+180.951 bln
21.41%
jan 1, 2010
817.175 bln
-208.943 bln
-20.36%
jan 1, 2011
1.046 trl
+228.785 bln
28.0%
jan 1, 2012
1.253 trl
+207.424 bln
19.83%
jan 1, 2013
1.32 trl
+66.764 bln
5.33%
jan 1, 2014
1.382 trl
+62.038 bln
4.7%
jan 1, 2015
1.388 trl
+5.386 bln
0.39%
jan 1, 2016
1.243 trl
-144.545 bln
-10.42%
Ranking of countries by current statistics by years


Comments: