29
/
en
AIzaSyAYiBZKx7MnpbEhh9jyipgxe19OcubqV5w
April 1, 2024
164971
Jordan
JOR
true
2
1
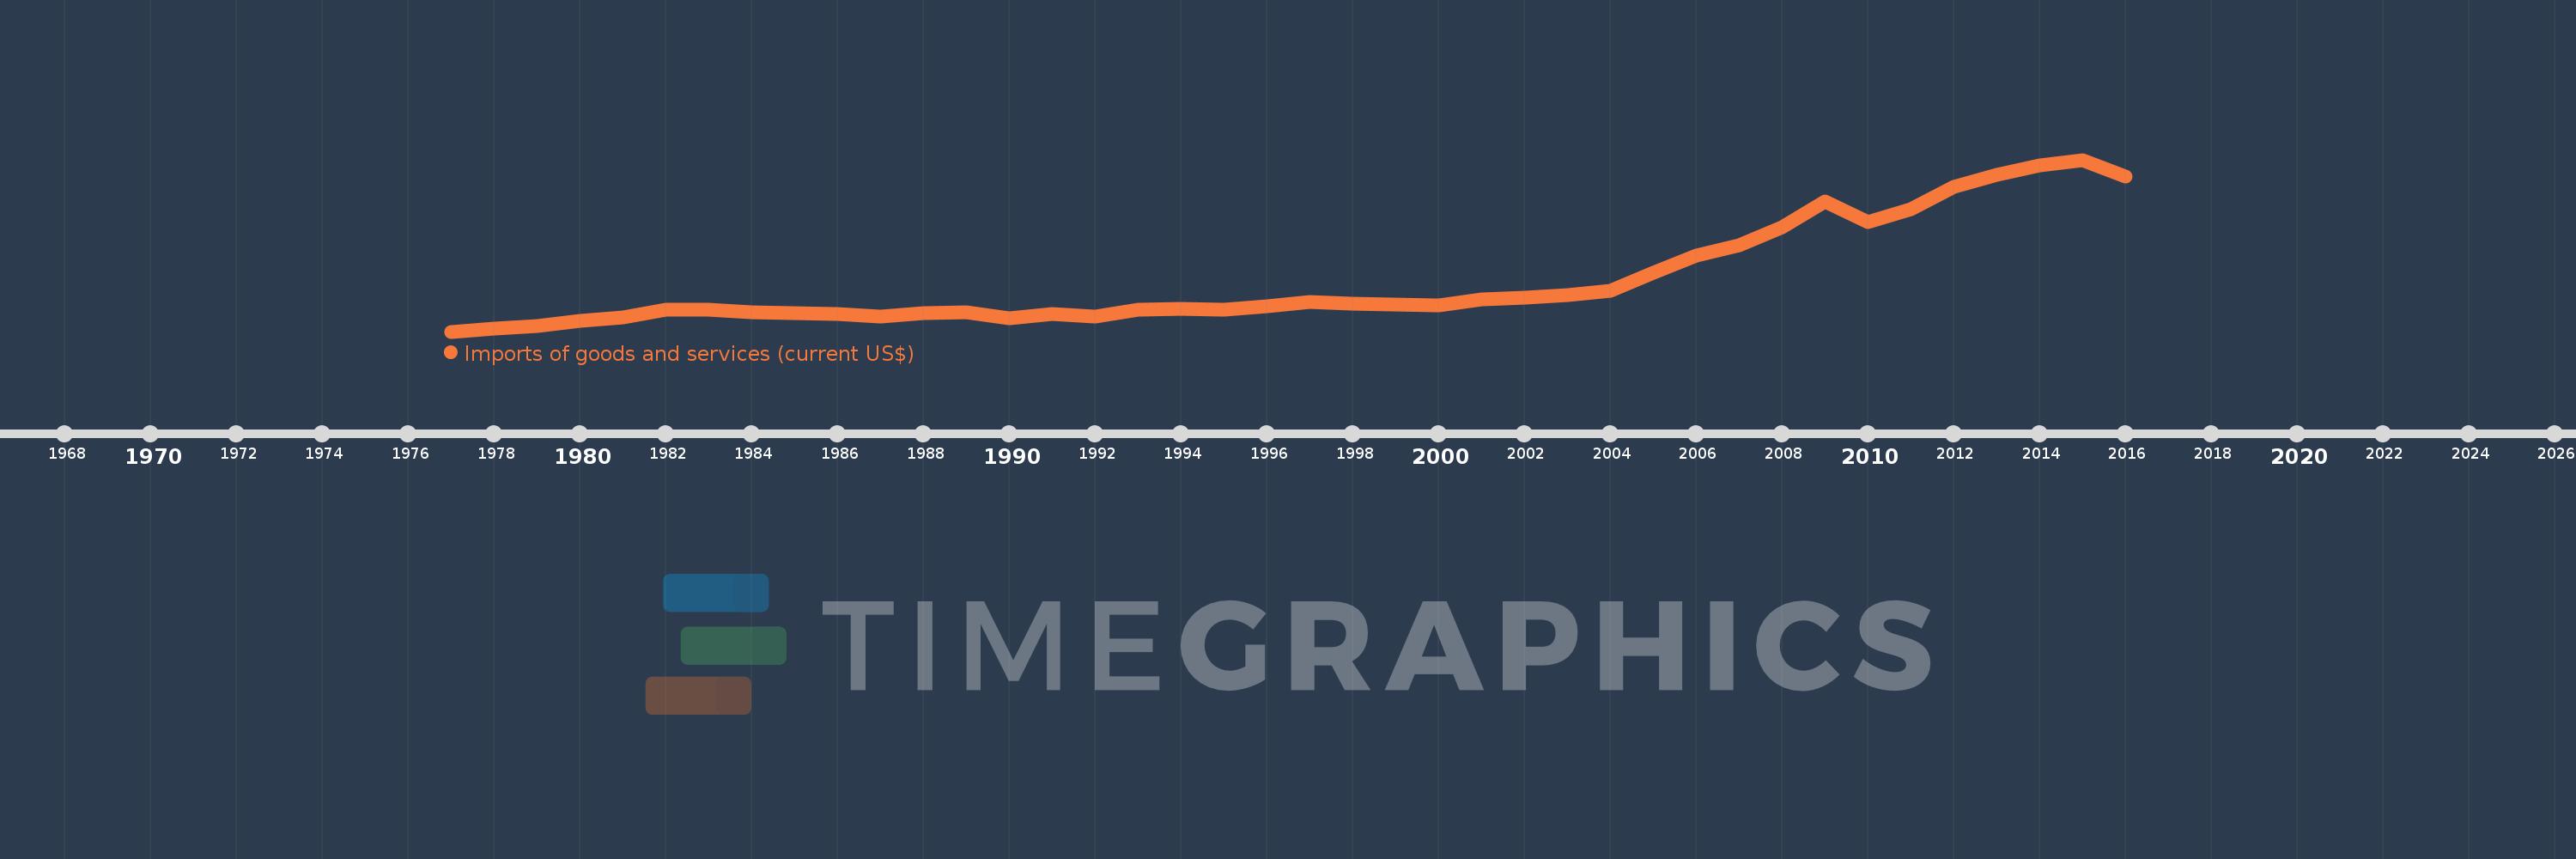
Imports of goods and services (current US$)
2016,2015,2014,2013,2012,2011,2010,2009,2008,2007,2006,2005,2004,2003,2002,2001,2000,1999,1998,1997,1996,1995,1994,1993,1992,1991,1990,1989,1988,1987,1986,1985,1984,1983,1982,1981,1980,1979,1978,1977
This statistics in other country:
AfghanistanAlbaniaAlgeriaAngolaAntigua and BarbudaArab WorldArgentinaArmeniaArubaAustraliaAustriaAzerbaijanBahamas, TheBahrainBangladeshBarbadosBelarusBelgiumBelizeBeninBermudaBhutanBoliviaBosnia and HerzegovinaBotswanaBrazilBrunei DarussalamBulgariaBurkina FasoBurundiCabo VerdeCambodiaCameroonCanadaCaribbean small statesCentral African RepublicCentral Europe and the BalticsChadChileChinaColombiaComorosCongo, Dem. Rep.Congo, Rep.Costa RicaCote d'IvoireCroatiaCubaCyprusCzech RepublicDenmarkDjiboutiDominicaDominican RepublicEarly-demographic dividendEast Asia & PacificEast Asia & Pacific (excluding high income)East Asia & Pacific (IDA & IBRD countries)EcuadorEgypt, Arab Rep.El SalvadorEquatorial GuineaEritreaEstoniaEthiopiaEuro areaEurope & Central AsiaEurope & Central Asia (excluding high income)Europe & Central Asia (IDA & IBRD countries)European UnionFaroe IslandsFijiFinlandFragile and conflict affected situationsFranceFrench PolynesiaGabonGambia, TheGeorgiaGermanyGhanaGreeceGrenadaGuatemalaGuineaGuinea-BissauGuyanaHaitiHeavily indebted poor countries (HIPC)High incomeHondurasHong Kong SAR, ChinaHungaryIBRD onlyIcelandIDA & IBRD totalIDA blendIDA onlyIDA totalIndiaIndonesiaIran, Islamic Rep.IraqIrelandIsraelItalyJamaicaJapanJordanKazakhstanKenyaKiribatiKorea, Rep.KosovoKuwaitKyrgyz RepublicLao PDRLate-demographic dividendLatin America & Caribbean Latin America & Caribbean (excluding high income)Latin America & the Caribbean (IDA & IBRD countries)LatviaLeast developed countries: UN classificationLebanonLesothoLiberiaLibyaLithuaniaLow & middle incomeLow incomeLower middle incomeLuxembourgMacao SAR, ChinaMacedonia, FYRMadagascarMalawiMalaysiaMaldivesMaliMaltaMauritaniaMauritiusMexicoMicronesia, Fed. Sts.Middle East & North AfricaMiddle East & North Africa (excluding high income)Middle East & North Africa (IDA & IBRD countries)Middle incomeMoldovaMongoliaMontenegroMoroccoMozambiqueMyanmarNamibiaNepalNetherlandsNew CaledoniaNew ZealandNicaraguaNigerNigeriaNorth AmericaNorwayOECD membersOmanOther small statesPacific island small statesPakistanPalauPanamaPapua New GuineaParaguayPeruPhilippinesPolandPortugalPost-demographic dividendPre-demographic dividendPuerto RicoQatarRomaniaRussian FederationRwandaSamoaSaudi ArabiaSenegalSerbiaSeychellesSierra LeoneSingaporeSlovak RepublicSloveniaSmall statesSolomon IslandsSomaliaSouth AfricaSouth AsiaSouth Asia (IDA & IBRD)South SudanSpainSri LankaSt. Kitts and NevisSt. LuciaSt. Vincent and the GrenadinesSub-Saharan Africa Sub-Saharan Africa (excluding high income)Sub-Saharan Africa (IDA & IBRD countries)SudanSurinameSwazilandSwedenSwitzerlandSyrian Arab RepublicTajikistanTanzaniaThailandTimor-LesteTogoTongaTrinidad and TobagoTunisiaTurkeyTurkmenistanUgandaUkraineUnited Arab EmiratesUnited KingdomUnited StatesUpper middle incomeUruguayUzbekistanVanuatuVenezuela, RBVietnamWest Bank and GazaWorldYemen, Rep.ZambiaZimbabwe Timeline:
This timeline shows a graph from 1977 to 2016 of Jordan. No data until 1976. Number of actual observations by date: 40.
Source name:
World Development Indicators
Source organization:
World Bank national accounts data, and OECD National Accounts data files.
Categories, topics:
Economy & Growth, Trade
Last updated:
apr 23, 2017
Indicators value changes by year
Minimum:
1.363 bln
jan 1, 1977
Maximum:
24.985 bln
jan 1, 2015
At the date of observation
Value
Absolute change
Change from previous value
jan 1, 1977
1.363 bln
+1.363 bln
0.0%
jan 1, 1978
1.738 bln
+375.281 mln
27.53%
jan 1, 1979
2.078 bln
+339.32 mln
19.52%
jan 1, 1980
2.838 bln
+760.276 mln
36.59%
jan 1, 1981
3.336 bln
+497.854 mln
17.54%
jan 1, 1982
4.321 bln
+984.837 mln
29.52%
jan 1, 1983
4.413 bln
+92.813 mln
2.15%
jan 1, 1984
4.002 bln
-411.13 mln
-9.32%
jan 1, 1985
3.951 bln
-51.358 mln
-1.28%
jan 1, 1986
3.808 bln
-142.685 mln
-3.61%
jan 1, 1987
3.427 bln
-381.017 mln
-10.01%
jan 1, 1988
3.899 bln
+471.528 mln
13.76%
jan 1, 1989
4.06 bln
+161.442 mln
4.14%
jan 1, 1990
3.14 bln
-919.667 mln
-22.65%
jan 1, 1991
3.728 bln
+587.594 mln
18.71%
jan 1, 1992
3.47 bln
-258.22 mln
-6.93%
jan 1, 1993
4.324 bln
+853.952 mln
24.61%
jan 1, 1994
4.493 bln
+169.446 mln
3.92%
jan 1, 1995
4.395 bln
-98.255 mln
-2.19%
jan 1, 1996
4.902 bln
+506.864 mln
11.53%
jan 1, 1997
5.416 bln
+514.111 mln
10.49%
jan 1, 1998
5.186 bln
-230.183 mln
-4.25%
jan 1, 1999
5.09 bln
-95.91 mln
-1.85%
jan 1, 2000
4.99 bln
-99.859 mln
-1.96%
jan 1, 2001
5.796 bln
+805.783 mln
16.15%
jan 1, 2002
6.027 bln
+231.453 mln
3.99%
jan 1, 2003
6.384 bln
+356.417 mln
5.91%
jan 1, 2004
6.967 bln
+583.498 mln
9.14%
jan 1, 2005
9.407 bln
+2.44 bln
35.02%
jan 1, 2006
11.859 bln
+2.452 bln
26.07%
jan 1, 2007
13.231 bln
+1.372 bln
11.57%
jan 1, 2008
15.7 bln
+2.469 bln
18.66%
jan 1, 2009
19.228 bln
+3.527 bln
22.47%
jan 1, 2010
16.459 bln
-2.769 bln
-14.4%
jan 1, 2011
18.241 bln
+1.783 bln
10.83%
jan 1, 2012
21.301 bln
+3.06 bln
16.77%
jan 1, 2013
22.975 bln
+1.674 bln
7.86%
jan 1, 2014
24.172 bln
+1.197 bln
5.21%
jan 1, 2015
24.985 bln
+812.958 mln
3.36%
jan 1, 2016
22.694 bln
-2.291 bln
-9.17%
Ranking of countries by current statistics by years


Comments: