29
/
en
AIzaSyAYiBZKx7MnpbEhh9jyipgxe19OcubqV5w
April 1, 2024
68921
Antigua and Barbuda
ATG
true
2
1
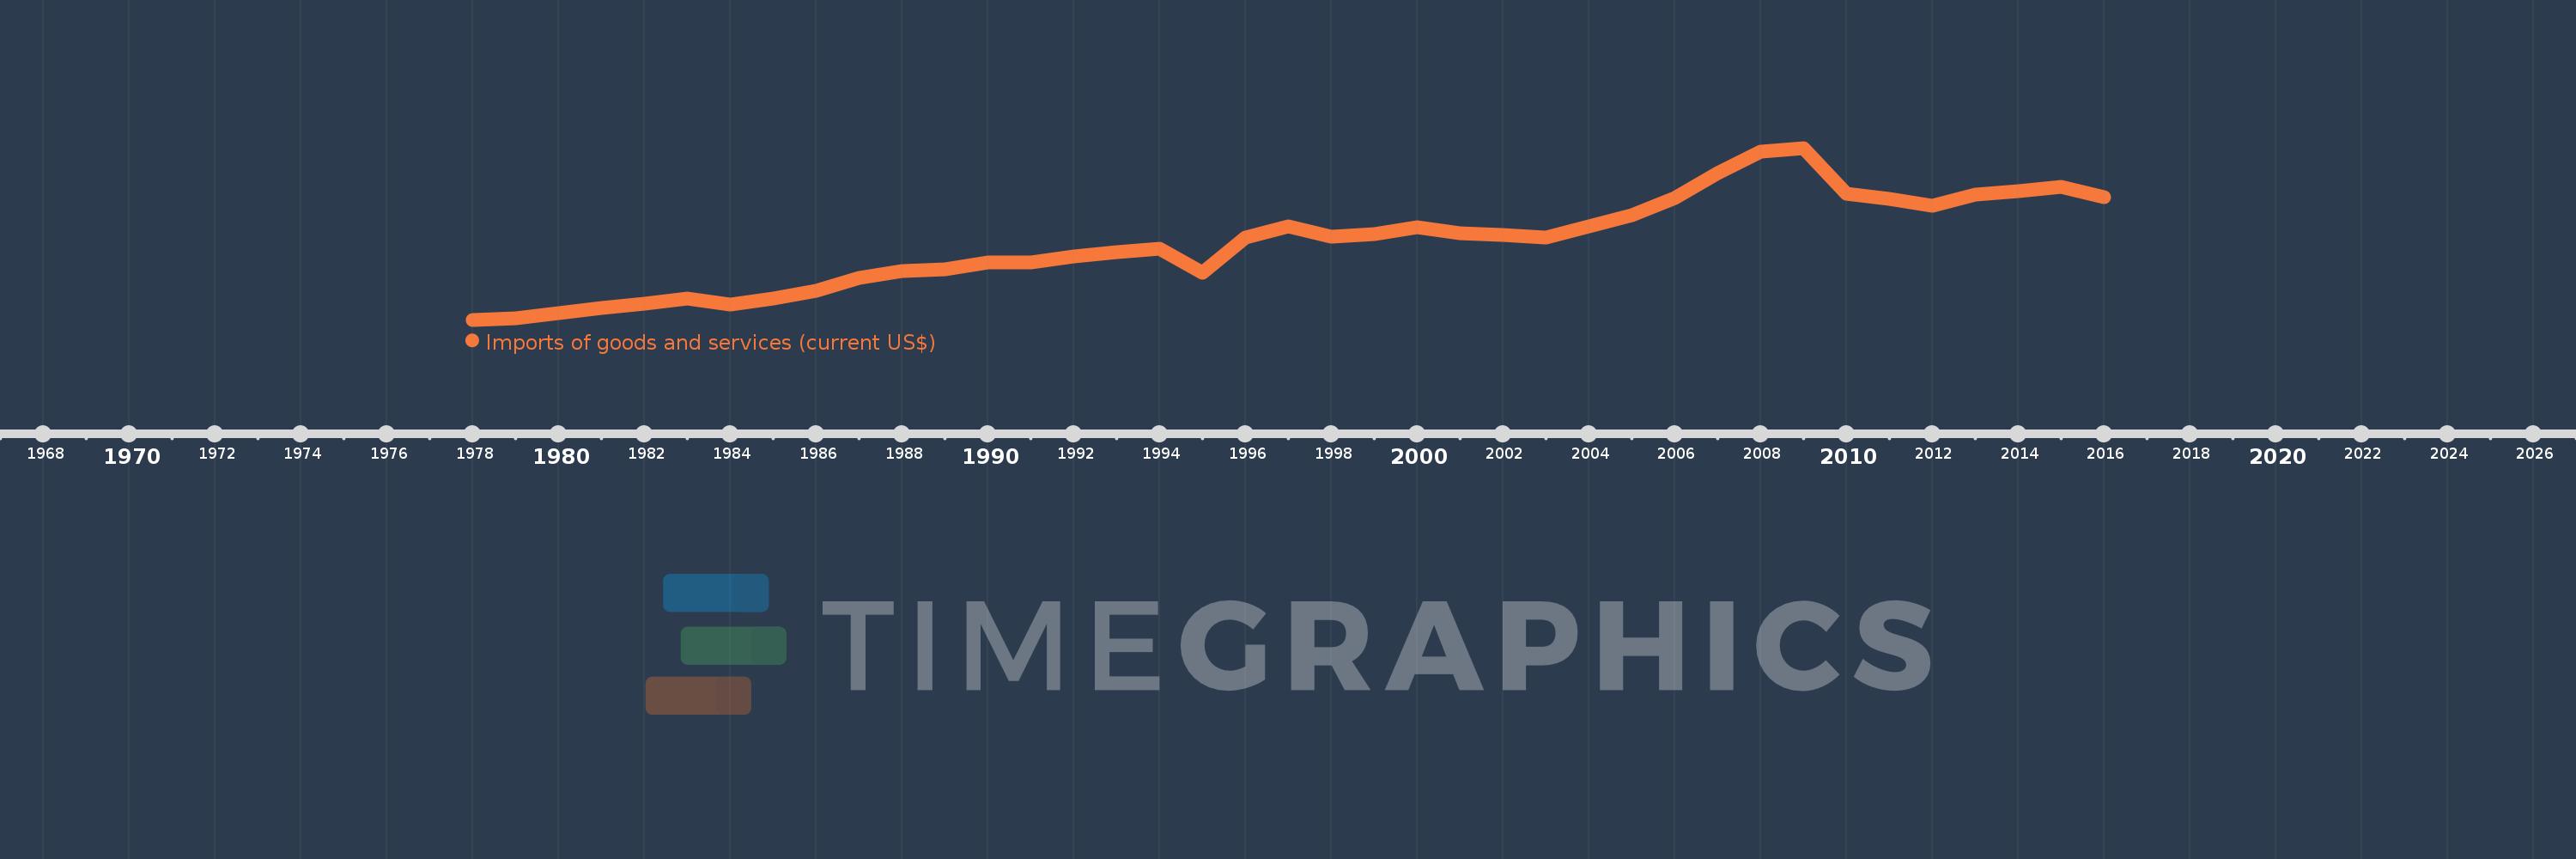
Imports of goods and services (current US$)
2016,2015,2014,2013,2012,2011,2010,2009,2008,2007,2006,2005,2004,2003,2002,2001,2000,1999,1998,1997,1996,1995,1994,1993,1992,1991,1990,1989,1988,1987,1986,1985,1984,1983,1982,1981,1980,1979,1978
This statistics in other country:
AfghanistanAlbaniaAlgeriaAngolaAntigua and BarbudaArab WorldArgentinaArmeniaArubaAustraliaAustriaAzerbaijanBahamas, TheBahrainBangladeshBarbadosBelarusBelgiumBelizeBeninBermudaBhutanBoliviaBosnia and HerzegovinaBotswanaBrazilBrunei DarussalamBulgariaBurkina FasoBurundiCabo VerdeCambodiaCameroonCanadaCaribbean small statesCentral African RepublicCentral Europe and the BalticsChadChileChinaColombiaComorosCongo, Dem. Rep.Congo, Rep.Costa RicaCote d'IvoireCroatiaCubaCyprusCzech RepublicDenmarkDjiboutiDominicaDominican RepublicEarly-demographic dividendEast Asia & PacificEast Asia & Pacific (excluding high income)East Asia & Pacific (IDA & IBRD countries)EcuadorEgypt, Arab Rep.El SalvadorEquatorial GuineaEritreaEstoniaEthiopiaEuro areaEurope & Central AsiaEurope & Central Asia (excluding high income)Europe & Central Asia (IDA & IBRD countries)European UnionFaroe IslandsFijiFinlandFragile and conflict affected situationsFranceFrench PolynesiaGabonGambia, TheGeorgiaGermanyGhanaGreeceGrenadaGuatemalaGuineaGuinea-BissauGuyanaHaitiHeavily indebted poor countries (HIPC)High incomeHondurasHong Kong SAR, ChinaHungaryIBRD onlyIcelandIDA & IBRD totalIDA blendIDA onlyIDA totalIndiaIndonesiaIran, Islamic Rep.IraqIrelandIsraelItalyJamaicaJapanJordanKazakhstanKenyaKiribatiKorea, Rep.KosovoKuwaitKyrgyz RepublicLao PDRLate-demographic dividendLatin America & Caribbean Latin America & Caribbean (excluding high income)Latin America & the Caribbean (IDA & IBRD countries)LatviaLeast developed countries: UN classificationLebanonLesothoLiberiaLibyaLithuaniaLow & middle incomeLow incomeLower middle incomeLuxembourgMacao SAR, ChinaMacedonia, FYRMadagascarMalawiMalaysiaMaldivesMaliMaltaMauritaniaMauritiusMexicoMicronesia, Fed. Sts.Middle East & North AfricaMiddle East & North Africa (excluding high income)Middle East & North Africa (IDA & IBRD countries)Middle incomeMoldovaMongoliaMontenegroMoroccoMozambiqueMyanmarNamibiaNepalNetherlandsNew CaledoniaNew ZealandNicaraguaNigerNigeriaNorth AmericaNorwayOECD membersOmanOther small statesPacific island small statesPakistanPalauPanamaPapua New GuineaParaguayPeruPhilippinesPolandPortugalPost-demographic dividendPre-demographic dividendPuerto RicoQatarRomaniaRussian FederationRwandaSamoaSaudi ArabiaSenegalSerbiaSeychellesSierra LeoneSingaporeSlovak RepublicSloveniaSmall statesSolomon IslandsSomaliaSouth AfricaSouth AsiaSouth Asia (IDA & IBRD)South SudanSpainSri LankaSt. Kitts and NevisSt. LuciaSt. Vincent and the GrenadinesSub-Saharan Africa Sub-Saharan Africa (excluding high income)Sub-Saharan Africa (IDA & IBRD countries)SudanSurinameSwazilandSwedenSwitzerlandSyrian Arab RepublicTajikistanTanzaniaThailandTimor-LesteTogoTongaTrinidad and TobagoTunisiaTurkeyTurkmenistanUgandaUkraineUnited Arab EmiratesUnited KingdomUnited StatesUpper middle incomeUruguayUzbekistanVanuatuVenezuela, RBVietnamWest Bank and GazaWorldYemen, Rep.ZambiaZimbabwe Timeline:
This timeline shows a graph from 1978 to 2016 of Antigua and Barbuda. No data until 1977. Number of actual observations by date: 39.
Source name:
World Development Indicators
Source organization:
World Bank national accounts data, and OECD National Accounts data files.
Categories, topics:
Economy & Growth, Trade
Last updated:
apr 23, 2017
Indicators value changes by year
Minimum:
34.811 mln
jan 1, 1978
Maximum:
952.208 mln
jan 1, 2009
At the date of observation
Value
Absolute change
Change from previous value
jan 1, 1978
34.811 mln
+34.811 mln
0.0%
jan 1, 1979
43.452 mln
+8.641 mln
24.82%
jan 1, 1980
69.6 mln
+26.148 mln
60.18%
jan 1, 1981
95.4 mln
+25.8 mln
37.07%
jan 1, 1982
118.956 mln
+23.556 mln
24.69%
jan 1, 1983
147.796 mln
+28.841 mln
24.24%
jan 1, 1984
117.211 mln
-30.585 mln
-20.69%
jan 1, 1985
147.493 mln
+30.281 mln
25.83%
jan 1, 1986
187.2 mln
+39.707 mln
26.92%
jan 1, 1987
260.067 mln
+72.867 mln
38.92%
jan 1, 1988
296.263 mln
+36.196 mln
13.92%
jan 1, 1989
305.8 mln
+9.537 mln
3.22%
jan 1, 1990
338.911 mln
+33.111 mln
10.83%
jan 1, 1991
340.559 mln
+1.648 mln
0.49%
jan 1, 1992
372.104 mln
+31.544 mln
9.26%
jan 1, 1993
395.363 mln
+23.259 mln
6.25%
jan 1, 1994
414.148 mln
+18.785 mln
4.75%
jan 1, 1995
286.407 mln
-127.741 mln
-30.84%
jan 1, 1996
472.444 mln
+186.037 mln
64.96%
jan 1, 1997
533.296 mln
+60.852 mln
12.88%
jan 1, 1998
478.289 mln
-55.007 mln
-10.31%
jan 1, 1999
489.922 mln
+11.633 mln
2.43%
jan 1, 2000
529.322 mln
+39.4 mln
8.04%
jan 1, 2001
498.462 mln
-30.861 mln
-5.83%
jan 1, 2002
486.573 mln
-11.889 mln
-2.39%
jan 1, 2003
474.44 mln
-12.133 mln
-2.49%
jan 1, 2004
534.751 mln
+60.312 mln
12.71%
jan 1, 2005
592.338 mln
+57.587 mln
10.77%
jan 1, 2006
682.721 mln
+90.382 mln
15.26%
jan 1, 2007
818.413 mln
+135.693 mln
19.88%
jan 1, 2008
932.372 mln
+113.959 mln
13.92%
jan 1, 2009
952.208 mln
+19.836 mln
2.13%
jan 1, 2010
706.477 mln
-245.731 mln
-25.81%
jan 1, 2011
678.93 mln
-27.547 mln
-3.9%
jan 1, 2012
641.368 mln
-37.562 mln
-5.53%
jan 1, 2013
701.983 mln
+60.615 mln
9.45%
jan 1, 2014
720.788 mln
+18.805 mln
2.68%
jan 1, 2015
742.593 mln
+21.805 mln
3.03%
jan 1, 2016
688.519 mln
-54.074 mln
-7.28%
Ranking of countries by current statistics by years


Comments: