29
/
en
AIzaSyAYiBZKx7MnpbEhh9jyipgxe19OcubqV5w
April 1, 2024
171821
Kuwait
KWT
true
2
1
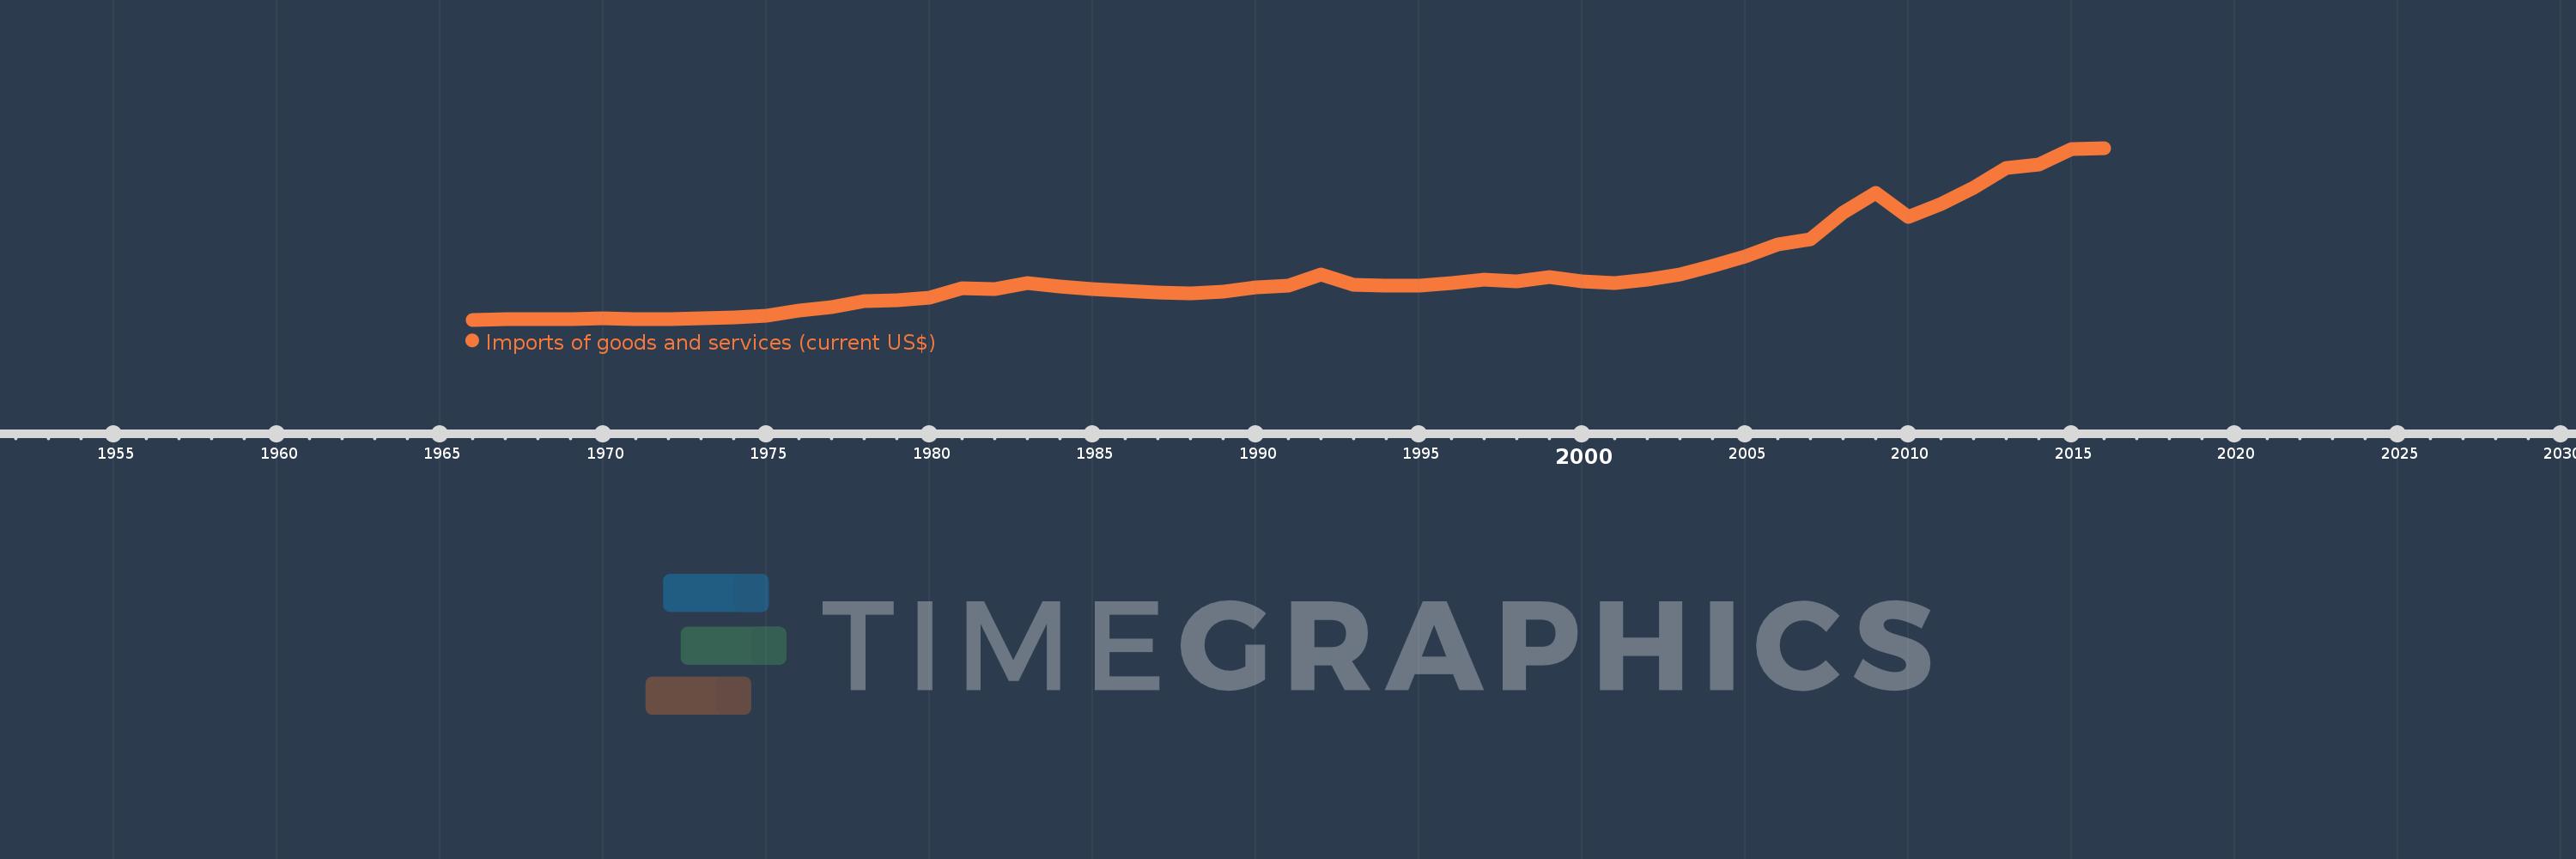
Imports of goods and services (current US$)
2016,2015,2014,2013,2012,2011,2010,2009,2008,2007,2006,2005,2004,2003,2002,2001,2000,1999,1998,1997,1996,1995,1994,1993,1992,1991,1990,1989,1988,1987,1986,1985,1984,1983,1982,1981,1980,1979,1978,1977,1976,1975,1974,1973,1972,1971,1970,1969,1968,1967,1966
This statistics in other country:
AfghanistanAlbaniaAlgeriaAngolaAntigua and BarbudaArab WorldArgentinaArmeniaArubaAustraliaAustriaAzerbaijanBahamas, TheBahrainBangladeshBarbadosBelarusBelgiumBelizeBeninBermudaBhutanBoliviaBosnia and HerzegovinaBotswanaBrazilBrunei DarussalamBulgariaBurkina FasoBurundiCabo VerdeCambodiaCameroonCanadaCaribbean small statesCentral African RepublicCentral Europe and the BalticsChadChileChinaColombiaComorosCongo, Dem. Rep.Congo, Rep.Costa RicaCote d'IvoireCroatiaCubaCyprusCzech RepublicDenmarkDjiboutiDominicaDominican RepublicEarly-demographic dividendEast Asia & PacificEast Asia & Pacific (excluding high income)East Asia & Pacific (IDA & IBRD countries)EcuadorEgypt, Arab Rep.El SalvadorEquatorial GuineaEritreaEstoniaEthiopiaEuro areaEurope & Central AsiaEurope & Central Asia (excluding high income)Europe & Central Asia (IDA & IBRD countries)European UnionFaroe IslandsFijiFinlandFragile and conflict affected situationsFranceFrench PolynesiaGabonGambia, TheGeorgiaGermanyGhanaGreeceGrenadaGuatemalaGuineaGuinea-BissauGuyanaHaitiHeavily indebted poor countries (HIPC)High incomeHondurasHong Kong SAR, ChinaHungaryIBRD onlyIcelandIDA & IBRD totalIDA blendIDA onlyIDA totalIndiaIndonesiaIran, Islamic Rep.IraqIrelandIsraelItalyJamaicaJapanJordanKazakhstanKenyaKiribatiKorea, Rep.KosovoKuwaitKyrgyz RepublicLao PDRLate-demographic dividendLatin America & Caribbean Latin America & Caribbean (excluding high income)Latin America & the Caribbean (IDA & IBRD countries)LatviaLeast developed countries: UN classificationLebanonLesothoLiberiaLibyaLithuaniaLow & middle incomeLow incomeLower middle incomeLuxembourgMacao SAR, ChinaMacedonia, FYRMadagascarMalawiMalaysiaMaldivesMaliMaltaMauritaniaMauritiusMexicoMicronesia, Fed. Sts.Middle East & North AfricaMiddle East & North Africa (excluding high income)Middle East & North Africa (IDA & IBRD countries)Middle incomeMoldovaMongoliaMontenegroMoroccoMozambiqueMyanmarNamibiaNepalNetherlandsNew CaledoniaNew ZealandNicaraguaNigerNigeriaNorth AmericaNorwayOECD membersOmanOther small statesPacific island small statesPakistanPalauPanamaPapua New GuineaParaguayPeruPhilippinesPolandPortugalPost-demographic dividendPre-demographic dividendPuerto RicoQatarRomaniaRussian FederationRwandaSamoaSaudi ArabiaSenegalSerbiaSeychellesSierra LeoneSingaporeSlovak RepublicSloveniaSmall statesSolomon IslandsSomaliaSouth AfricaSouth AsiaSouth Asia (IDA & IBRD)South SudanSpainSri LankaSt. Kitts and NevisSt. LuciaSt. Vincent and the GrenadinesSub-Saharan Africa Sub-Saharan Africa (excluding high income)Sub-Saharan Africa (IDA & IBRD countries)SudanSurinameSwazilandSwedenSwitzerlandSyrian Arab RepublicTajikistanTanzaniaThailandTimor-LesteTogoTongaTrinidad and TobagoTunisiaTurkeyTurkmenistanUgandaUkraineUnited Arab EmiratesUnited KingdomUnited StatesUpper middle incomeUruguayUzbekistanVanuatuVenezuela, RBVietnamWest Bank and GazaWorldYemen, Rep.ZambiaZimbabwe Timeline:
This timeline shows a graph from 1966 to 2016 of Kuwait. No data until 1965. Number of actual observations by date: 51.
Source name:
World Development Indicators
Source organization:
World Bank national accounts data, and OECD National Accounts data files.
Categories, topics:
Economy & Growth, Trade
Last updated:
apr 23, 2017
Indicators value changes by year
Minimum:
484.458 mln
jan 1, 1966
Maximum:
51.618 bln
jan 1, 2016
At the date of observation
Value
Absolute change
Change from previous value
jan 1, 1966
484.458 mln
+484.458 mln
0.0%
jan 1, 1967
582.47 mln
+98.012 mln
20.23%
jan 1, 1968
694.483 mln
+112.013 mln
19.23%
jan 1, 1969
694.483 mln
0.0
0.0%
jan 1, 1970
800.896 mln
+106.413 mln
15.32%
jan 1, 1971
693.083 mln
-107.813 mln
-13.46%
jan 1, 1972
724.235 mln
+31.152 mln
4.49%
jan 1, 1973
919.732 mln
+195.498 mln
26.99%
jan 1, 1974
1.199 bln
+279.189 mln
30.36%
jan 1, 1975
1.8 bln
+601.215 mln
50.15%
jan 1, 1976
3.128 bln
+1.327 bln
73.74%
jan 1, 1977
4.275 bln
+1.147 bln
36.69%
jan 1, 1978
6.141 bln
+1.866 bln
43.65%
jan 1, 1979
6.18 bln
+38.608 mln
0.63%
jan 1, 1980
7.131 bln
+951.399 mln
15.4%
jan 1, 1981
9.822 bln
+2.691 bln
37.74%
jan 1, 1982
9.641 bln
-181.1 mln
-1.84%
jan 1, 1983
11.299 bln
+1.658 bln
17.19%
jan 1, 1984
10.3 bln
-999.542 mln
-8.85%
jan 1, 1985
9.686 bln
-613.602 mln
-5.96%
jan 1, 1986
9.166 bln
-520.359 mln
-5.37%
jan 1, 1987
8.596 bln
-569.55 mln
-6.21%
jan 1, 1988
8.303 bln
-293.174 mln
-3.41%
jan 1, 1989
8.885 bln
+582.471 mln
7.02%
jan 1, 1990
10.058 bln
+1.173 bln
13.2%
jan 1, 1991
10.701 bln
+643.526 mln
6.4%
jan 1, 1992
13.839 bln
+3.138 bln
29.32%
jan 1, 1993
10.767 bln
-3.072 bln
-22.2%
jan 1, 1994
10.603 bln
-164.223 mln
-1.53%
jan 1, 1995
10.519 bln
-84.13 mln
-0.79%
jan 1, 1996
11.411 bln
+892.339 mln
8.48%
jan 1, 1997
12.341 bln
+930.492 mln
8.15%
jan 1, 1998
12.018 bln
-323.546 mln
-2.62%
jan 1, 1999
13.255 bln
+1.237 bln
10.29%
jan 1, 2000
11.879 bln
-1.375 bln
-10.38%
jan 1, 2001
11.369 bln
-510.136 mln
-4.29%
jan 1, 2002
12.4 bln
+1.031 bln
9.07%
jan 1, 2003
13.962 bln
+1.562 bln
12.6%
jan 1, 2004
16.5 bln
+2.538 bln
18.18%
jan 1, 2005
19.247 bln
+2.747 bln
16.65%
jan 1, 2006
22.839 bln
+3.592 bln
18.66%
jan 1, 2007
24.542 bln
+1.703 bln
7.46%
jan 1, 2008
32.463 bln
+7.921 bln
32.28%
jan 1, 2009
38.211 bln
+5.748 bln
17.7%
jan 1, 2010
31.129 bln
-7.081 bln
-18.53%
jan 1, 2011
35.035 bln
+3.906 bln
12.55%
jan 1, 2012
39.891 bln
+4.856 bln
13.86%
jan 1, 2013
45.745 bln
+5.854 bln
14.67%
jan 1, 2014
46.58 bln
+834.781 mln
1.82%
jan 1, 2015
51.279 bln
+4.699 bln
10.09%
jan 1, 2016
51.618 bln
+339.49 mln
0.66%
Ranking of countries by current statistics by years


Comments: