29
/
en
AIzaSyAYiBZKx7MnpbEhh9jyipgxe19OcubqV5w
April 1, 2024
24980
Caribbean small states
CSS
false
2
1
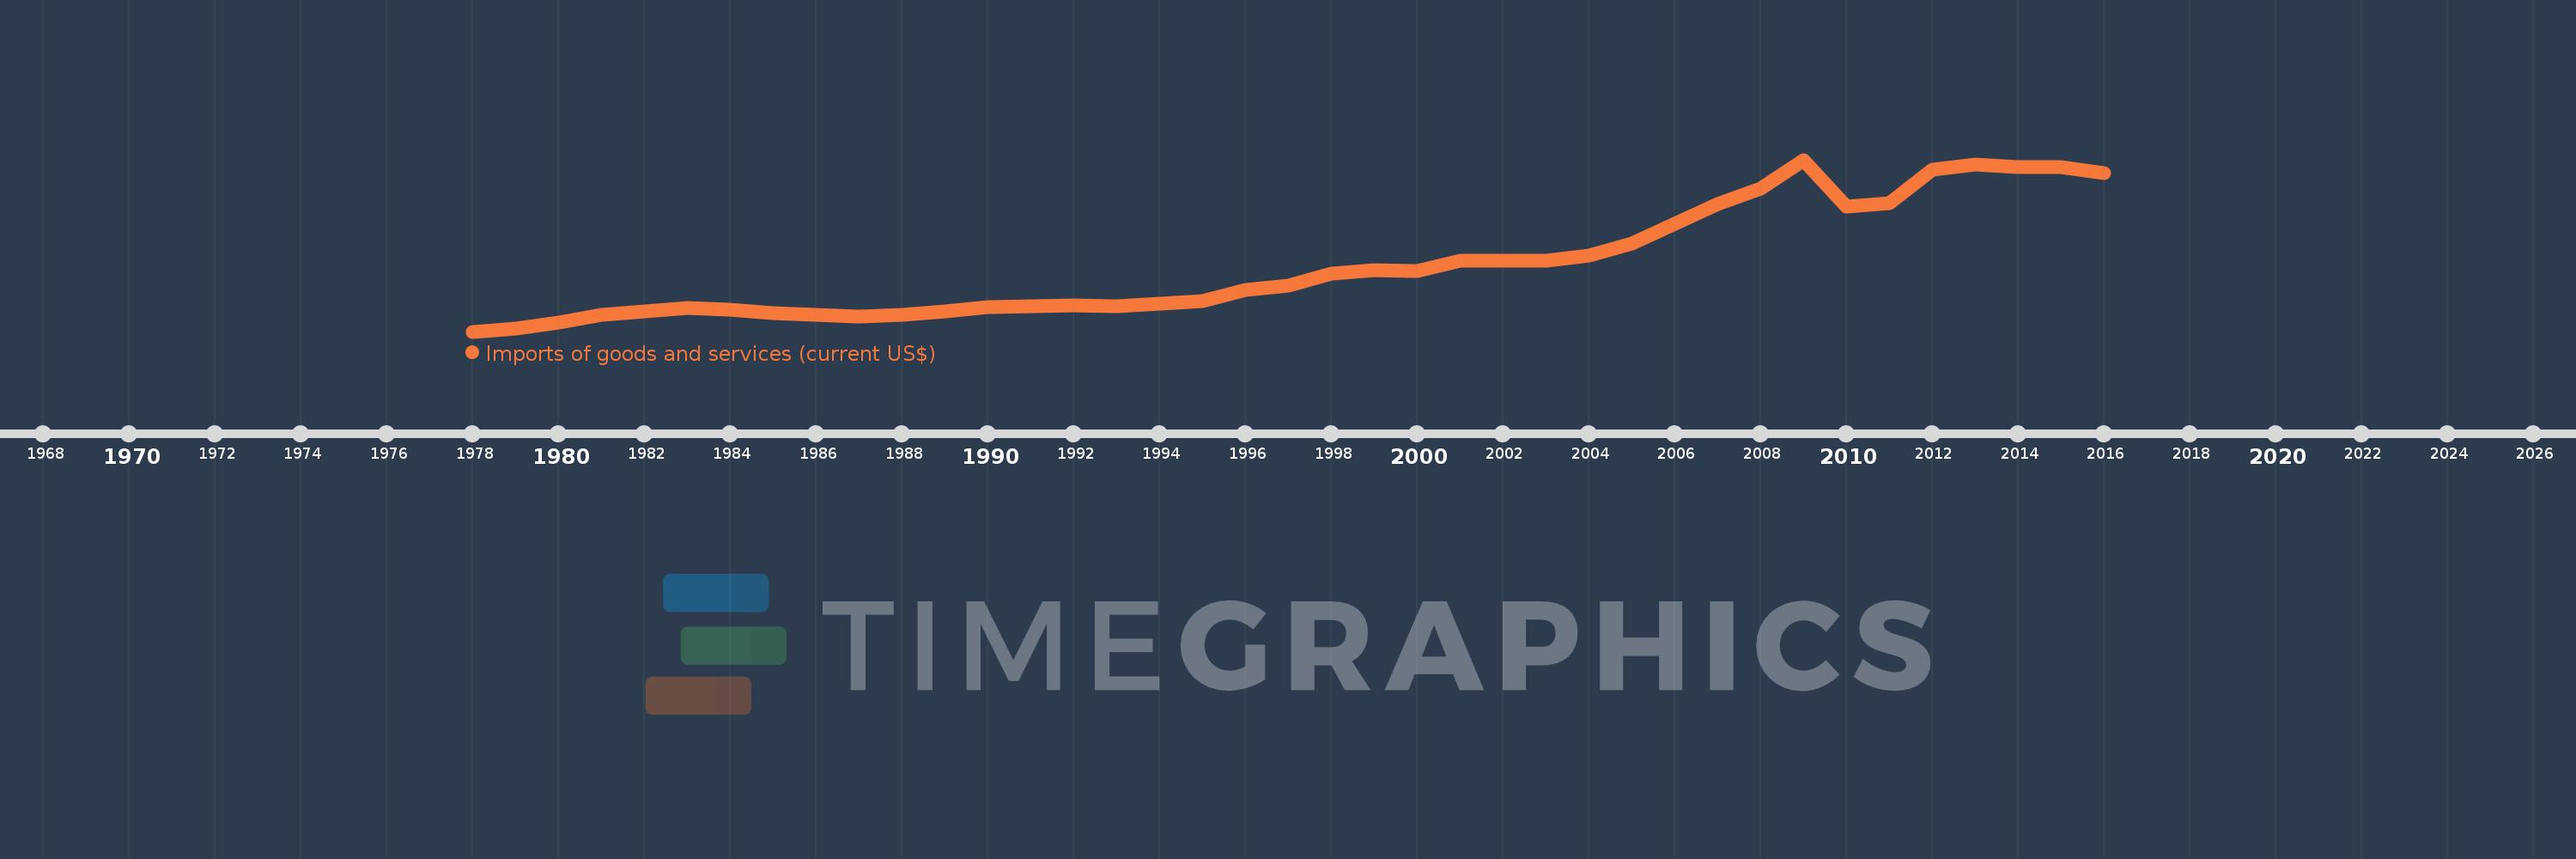
Imports of goods and services (current US$)
2016,2015,2014,2013,2012,2011,2010,2009,2008,2007,2006,2005,2004,2003,2002,2001,2000,1999,1998,1997,1996,1995,1994,1993,1992,1991,1990,1989,1988,1987,1986,1985,1984,1983,1982,1981,1980,1979,1978
This statistics in other country:
AfghanistanAlbaniaAlgeriaAngolaAntigua and BarbudaArab WorldArgentinaArmeniaArubaAustraliaAustriaAzerbaijanBahamas, TheBahrainBangladeshBarbadosBelarusBelgiumBelizeBeninBermudaBhutanBoliviaBosnia and HerzegovinaBotswanaBrazilBrunei DarussalamBulgariaBurkina FasoBurundiCabo VerdeCambodiaCameroonCanadaCaribbean small statesCentral African RepublicCentral Europe and the BalticsChadChileChinaColombiaComorosCongo, Dem. Rep.Congo, Rep.Costa RicaCote d'IvoireCroatiaCubaCyprusCzech RepublicDenmarkDjiboutiDominicaDominican RepublicEarly-demographic dividendEast Asia & PacificEast Asia & Pacific (excluding high income)East Asia & Pacific (IDA & IBRD countries)EcuadorEgypt, Arab Rep.El SalvadorEquatorial GuineaEritreaEstoniaEthiopiaEuro areaEurope & Central AsiaEurope & Central Asia (excluding high income)Europe & Central Asia (IDA & IBRD countries)European UnionFaroe IslandsFijiFinlandFragile and conflict affected situationsFranceFrench PolynesiaGabonGambia, TheGeorgiaGermanyGhanaGreeceGrenadaGuatemalaGuineaGuinea-BissauGuyanaHaitiHeavily indebted poor countries (HIPC)High incomeHondurasHong Kong SAR, ChinaHungaryIBRD onlyIcelandIDA & IBRD totalIDA blendIDA onlyIDA totalIndiaIndonesiaIran, Islamic Rep.IraqIrelandIsraelItalyJamaicaJapanJordanKazakhstanKenyaKiribatiKorea, Rep.KosovoKuwaitKyrgyz RepublicLao PDRLate-demographic dividendLatin America & Caribbean Latin America & Caribbean (excluding high income)Latin America & the Caribbean (IDA & IBRD countries)LatviaLeast developed countries: UN classificationLebanonLesothoLiberiaLibyaLithuaniaLow & middle incomeLow incomeLower middle incomeLuxembourgMacao SAR, ChinaMacedonia, FYRMadagascarMalawiMalaysiaMaldivesMaliMaltaMauritaniaMauritiusMexicoMicronesia, Fed. Sts.Middle East & North AfricaMiddle East & North Africa (excluding high income)Middle East & North Africa (IDA & IBRD countries)Middle incomeMoldovaMongoliaMontenegroMoroccoMozambiqueMyanmarNamibiaNepalNetherlandsNew CaledoniaNew ZealandNicaraguaNigerNigeriaNorth AmericaNorwayOECD membersOmanOther small statesPacific island small statesPakistanPalauPanamaPapua New GuineaParaguayPeruPhilippinesPolandPortugalPost-demographic dividendPre-demographic dividendPuerto RicoQatarRomaniaRussian FederationRwandaSamoaSaudi ArabiaSenegalSerbiaSeychellesSierra LeoneSingaporeSlovak RepublicSloveniaSmall statesSolomon IslandsSomaliaSouth AfricaSouth AsiaSouth Asia (IDA & IBRD)South SudanSpainSri LankaSt. Kitts and NevisSt. LuciaSt. Vincent and the GrenadinesSub-Saharan Africa Sub-Saharan Africa (excluding high income)Sub-Saharan Africa (IDA & IBRD countries)SudanSurinameSwazilandSwedenSwitzerlandSyrian Arab RepublicTajikistanTanzaniaThailandTimor-LesteTogoTongaTrinidad and TobagoTunisiaTurkeyTurkmenistanUgandaUkraineUnited Arab EmiratesUnited KingdomUnited StatesUpper middle incomeUruguayUzbekistanVanuatuVenezuela, RBVietnamWest Bank and GazaWorldYemen, Rep.ZambiaZimbabwe Timeline:
This timeline shows a graph from 1978 to 2016 of Caribbean small states. No data until 1977. Number of actual observations by date: 39.
Source name:
World Development Indicators
Source organization:
World Bank national accounts data, and OECD National Accounts data files.
Categories, topics:
Economy & Growth, Trade
Last updated:
apr 23, 2017
Indicators value changes by year
Minimum:
3.934 bln
jan 1, 1978
Maximum:
34.419 bln
jan 1, 2009
At the date of observation
Value
Absolute change
Change from previous value
jan 1, 1978
3.934 bln
+3.934 bln
0.0%
jan 1, 1979
4.428 bln
+494.123 mln
12.56%
jan 1, 1980
5.481 bln
+1.052 bln
23.76%
jan 1, 1981
6.975 bln
+1.494 bln
27.26%
jan 1, 1982
7.471 bln
+496.234 mln
7.11%
jan 1, 1983
8.146 bln
+675.069 mln
9.04%
jan 1, 1984
7.827 bln
-318.448 mln
-3.91%
jan 1, 1985
7.276 bln
-551.202 mln
-7.04%
jan 1, 1986
6.891 bln
-385.113 mln
-5.29%
jan 1, 1987
6.676 bln
-214.823 mln
-3.12%
jan 1, 1988
6.861 bln
+184.624 mln
2.77%
jan 1, 1989
7.518 bln
+657.413 mln
9.58%
jan 1, 1990
8.306 bln
+788.034 mln
10.48%
jan 1, 1991
8.471 bln
+164.857 mln
1.98%
jan 1, 1992
8.658 bln
+186.894 mln
2.21%
jan 1, 1993
8.455 bln
-203.061 mln
-2.35%
jan 1, 1994
8.962 bln
+507.46 mln
6.0%
jan 1, 1995
9.38 bln
+417.521 mln
4.66%
jan 1, 1996
11.387 bln
+2.007 bln
21.4%
jan 1, 1997
12.138 bln
+750.977 mln
6.59%
jan 1, 1998
14.166 bln
+2.028 bln
16.71%
jan 1, 1999
14.889 bln
+723.215 mln
5.11%
jan 1, 2000
14.697 bln
-192.387 mln
-1.29%
jan 1, 2001
16.473 bln
+1.776 bln
12.09%
jan 1, 2002
16.524 bln
+51.438 mln
0.31%
jan 1, 2003
16.448 bln
-76.001 mln
-0.46%
jan 1, 2004
17.386 bln
+937.124 mln
5.7%
jan 1, 2005
19.546 bln
+2.16 bln
12.43%
jan 1, 2006
23.119 bln
+3.573 bln
18.28%
jan 1, 2007
26.58 bln
+3.461 bln
14.97%
jan 1, 2008
29.313 bln
+2.733 bln
10.28%
jan 1, 2009
34.419 bln
+5.106 bln
17.42%
jan 1, 2010
26.182 bln
-8.237 bln
-23.93%
jan 1, 2011
26.719 bln
+536.983 mln
2.05%
jan 1, 2012
32.734 bln
+6.015 bln
22.51%
jan 1, 2013
33.525 bln
+790.96 mln
2.42%
jan 1, 2014
33.134 bln
-391.214 mln
-1.17%
jan 1, 2015
33.067 bln
-67.162 mln
-0.2%
jan 1, 2016
32.108 bln
-959.31 mln
-2.9%
Ranking of countries by current statistics by years


Comments: