29
/
en
AIzaSyAYiBZKx7MnpbEhh9jyipgxe19OcubqV5w
April 1, 2024
135650
Gabon
GAB
true
2
1
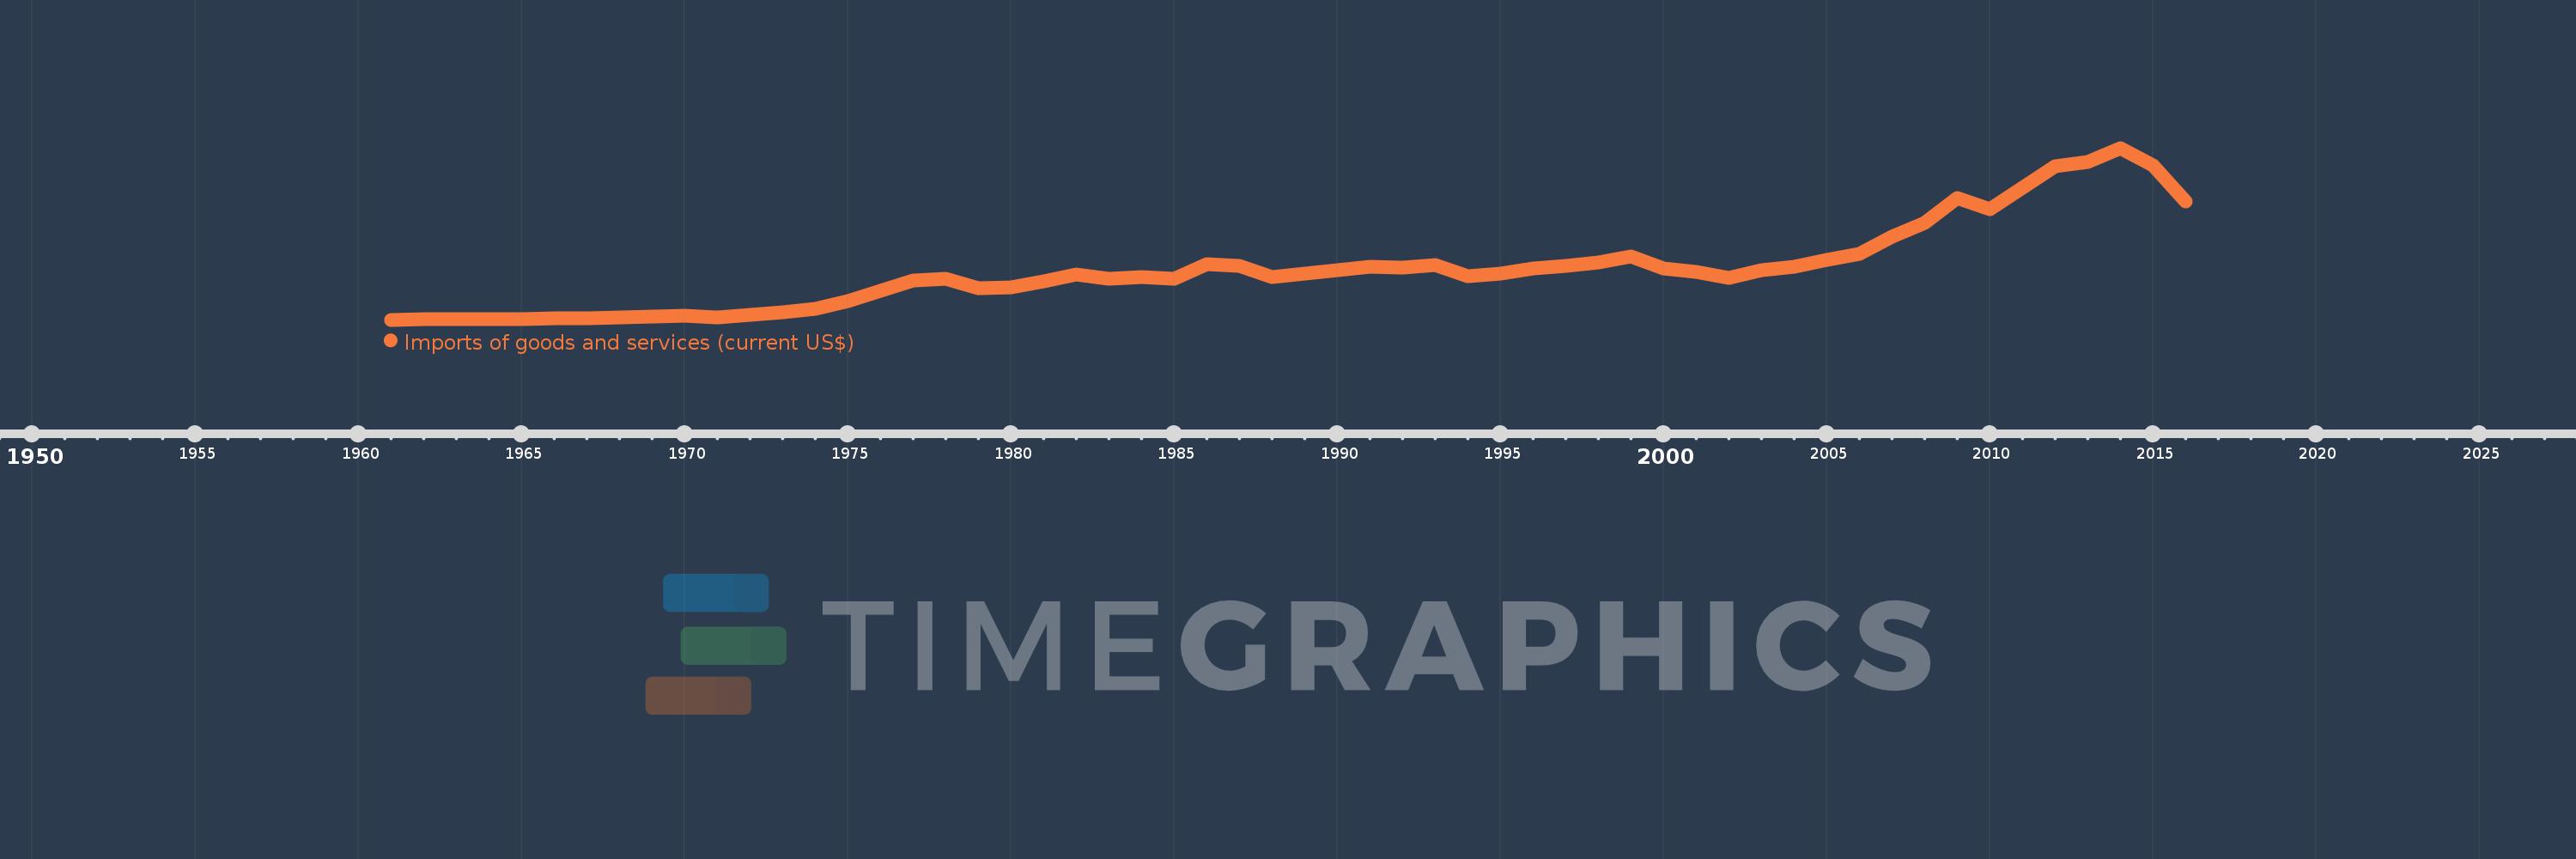
Imports of goods and services (current US$)
2016,2015,2014,2013,2012,2011,2010,2009,2008,2007,2006,2005,2004,2003,2002,2001,2000,1999,1998,1997,1996,1995,1994,1993,1992,1991,1990,1989,1988,1987,1986,1985,1984,1983,1982,1981,1980,1979,1978,1977,1976,1975,1974,1973,1972,1971,1970,1969,1968,1967,1966,1965,1964,1963,1962,1961
This statistics in other country:
AfghanistanAlbaniaAlgeriaAngolaAntigua and BarbudaArab WorldArgentinaArmeniaArubaAustraliaAustriaAzerbaijanBahamas, TheBahrainBangladeshBarbadosBelarusBelgiumBelizeBeninBermudaBhutanBoliviaBosnia and HerzegovinaBotswanaBrazilBrunei DarussalamBulgariaBurkina FasoBurundiCabo VerdeCambodiaCameroonCanadaCaribbean small statesCentral African RepublicCentral Europe and the BalticsChadChileChinaColombiaComorosCongo, Dem. Rep.Congo, Rep.Costa RicaCote d'IvoireCroatiaCubaCyprusCzech RepublicDenmarkDjiboutiDominicaDominican RepublicEarly-demographic dividendEast Asia & PacificEast Asia & Pacific (excluding high income)East Asia & Pacific (IDA & IBRD countries)EcuadorEgypt, Arab Rep.El SalvadorEquatorial GuineaEritreaEstoniaEthiopiaEuro areaEurope & Central AsiaEurope & Central Asia (excluding high income)Europe & Central Asia (IDA & IBRD countries)European UnionFaroe IslandsFijiFinlandFragile and conflict affected situationsFranceFrench PolynesiaGabonGambia, TheGeorgiaGermanyGhanaGreeceGrenadaGuatemalaGuineaGuinea-BissauGuyanaHaitiHeavily indebted poor countries (HIPC)High incomeHondurasHong Kong SAR, ChinaHungaryIBRD onlyIcelandIDA & IBRD totalIDA blendIDA onlyIDA totalIndiaIndonesiaIran, Islamic Rep.IraqIrelandIsraelItalyJamaicaJapanJordanKazakhstanKenyaKiribatiKorea, Rep.KosovoKuwaitKyrgyz RepublicLao PDRLate-demographic dividendLatin America & Caribbean Latin America & Caribbean (excluding high income)Latin America & the Caribbean (IDA & IBRD countries)LatviaLeast developed countries: UN classificationLebanonLesothoLiberiaLibyaLithuaniaLow & middle incomeLow incomeLower middle incomeLuxembourgMacao SAR, ChinaMacedonia, FYRMadagascarMalawiMalaysiaMaldivesMaliMaltaMauritaniaMauritiusMexicoMicronesia, Fed. Sts.Middle East & North AfricaMiddle East & North Africa (excluding high income)Middle East & North Africa (IDA & IBRD countries)Middle incomeMoldovaMongoliaMontenegroMoroccoMozambiqueMyanmarNamibiaNepalNetherlandsNew CaledoniaNew ZealandNicaraguaNigerNigeriaNorth AmericaNorwayOECD membersOmanOther small statesPacific island small statesPakistanPalauPanamaPapua New GuineaParaguayPeruPhilippinesPolandPortugalPost-demographic dividendPre-demographic dividendPuerto RicoQatarRomaniaRussian FederationRwandaSamoaSaudi ArabiaSenegalSerbiaSeychellesSierra LeoneSingaporeSlovak RepublicSloveniaSmall statesSolomon IslandsSomaliaSouth AfricaSouth AsiaSouth Asia (IDA & IBRD)South SudanSpainSri LankaSt. Kitts and NevisSt. LuciaSt. Vincent and the GrenadinesSub-Saharan Africa Sub-Saharan Africa (excluding high income)Sub-Saharan Africa (IDA & IBRD countries)SudanSurinameSwazilandSwedenSwitzerlandSyrian Arab RepublicTajikistanTanzaniaThailandTimor-LesteTogoTongaTrinidad and TobagoTunisiaTurkeyTurkmenistanUgandaUkraineUnited Arab EmiratesUnited KingdomUnited StatesUpper middle incomeUruguayUzbekistanVanuatuVenezuela, RBVietnamWest Bank and GazaWorldYemen, Rep.ZambiaZimbabwe Timeline:
This timeline shows a graph from 1961 to 2016 of Gabon. No data until 1960. Number of actual observations by date: 56.
Source name:
World Development Indicators
Source organization:
World Bank national accounts data, and OECD National Accounts data files.
Categories, topics:
Economy & Growth, Trade
Last updated:
apr 23, 2017
Indicators value changes by year
Minimum:
46.157 mln
jan 1, 1961
Maximum:
5.854 bln
jan 1, 2014
At the date of observation
Value
Absolute change
Change from previous value
jan 1, 1961
46.157 mln
+46.157 mln
0.0%
jan 1, 1962
53.079 mln
+6.921 mln
15.0%
jan 1, 1963
56.244 mln
+3.165 mln
5.96%
jan 1, 1964
70.124 mln
+13.881 mln
24.68%
jan 1, 1965
77.54 mln
+7.416 mln
10.58%
jan 1, 1966
84.469 mln
+6.929 mln
8.94%
jan 1, 1967
97.282 mln
+12.813 mln
15.17%
jan 1, 1968
130.487 mln
+33.206 mln
34.13%
jan 1, 1969
145.013 mln
+14.525 mln
11.13%
jan 1, 1970
171.949 mln
+26.937 mln
18.58%
jan 1, 1971
123.009 mln
-48.94 mln
-28.46%
jan 1, 1972
199.741 mln
+76.732 mln
62.38%
jan 1, 1973
311.076 mln
+111.335 mln
55.74%
jan 1, 1974
416.799 mln
+105.723 mln
33.99%
jan 1, 1975
668.039 mln
+251.24 mln
60.28%
jan 1, 1976
1.034 bln
+365.497 mln
54.71%
jan 1, 1977
1.387 bln
+353.781 mln
34.23%
jan 1, 1978
1.44 bln
+52.77 mln
3.8%
jan 1, 1979
1.121 bln
-318.91 mln
-22.15%
jan 1, 1980
1.133 bln
+12.23 mln
1.09%
jan 1, 1981
1.354 bln
+220.251 mln
19.43%
jan 1, 1982
1.572 bln
+218.116 mln
16.11%
jan 1, 1983
1.435 bln
-136.62 mln
-8.69%
jan 1, 1984
1.477 bln
+41.495 mln
2.89%
jan 1, 1985
1.432 bln
-44.926 mln
-3.04%
jan 1, 1986
1.913 bln
+481.413 mln
33.62%
jan 1, 1987
1.862 bln
-51.196 mln
-2.68%
jan 1, 1988
1.484 bln
-377.925 mln
-20.3%
jan 1, 1989
1.602 bln
+118.482 mln
7.98%
jan 1, 1990
1.725 bln
+122.226 mln
7.63%
jan 1, 1991
1.837 bln
+112.095 mln
6.5%
jan 1, 1992
1.798 bln
-39.183 mln
-2.13%
jan 1, 1993
1.89 bln
+92.221 mln
5.13%
jan 1, 1994
1.513 bln
-377.1 mln
-19.95%
jan 1, 1995
1.603 bln
+90.279 mln
5.97%
jan 1, 1996
1.773 bln
+169.641 mln
10.58%
jan 1, 1997
1.879 bln
+106.796 mln
6.02%
jan 1, 1998
1.983 bln
+103.825 mln
5.52%
jan 1, 1999
2.178 bln
+194.231 mln
9.79%
jan 1, 2000
1.777 bln
-400.042 mln
-18.37%
jan 1, 2001
1.656 bln
-121.824 mln
-6.85%
jan 1, 2002
1.474 bln
-181.948 mln
-10.99%
jan 1, 2003
1.707 bln
+233.586 mln
15.85%
jan 1, 2004
1.843 bln
+136.195 mln
7.98%
jan 1, 2005
2.073 bln
+229.64 mln
12.46%
jan 1, 2006
2.275 bln
+201.535 mln
9.72%
jan 1, 2007
2.86 bln
+585.399 mln
25.74%
jan 1, 2008
3.309 bln
+449.179 mln
15.71%
jan 1, 2009
4.156 bln
+846.923 mln
25.59%
jan 1, 2010
3.78 bln
-375.817 mln
-9.04%
jan 1, 2011
4.522 bln
+741.766 mln
19.62%
jan 1, 2012
5.229 bln
+707.224 mln
15.64%
jan 1, 2013
5.391 bln
+161.2 mln
3.08%
jan 1, 2014
5.854 bln
+463.242 mln
8.59%
jan 1, 2015
5.272 bln
-581.757 mln
-9.94%
jan 1, 2016
4.031 bln
-1.241 bln
-23.55%
Ranking of countries by current statistics by years


Comments: