29
/
en
AIzaSyAYiBZKx7MnpbEhh9jyipgxe19OcubqV5w
April 1, 2024
279914
Vanuatu
VUT
true
2
1
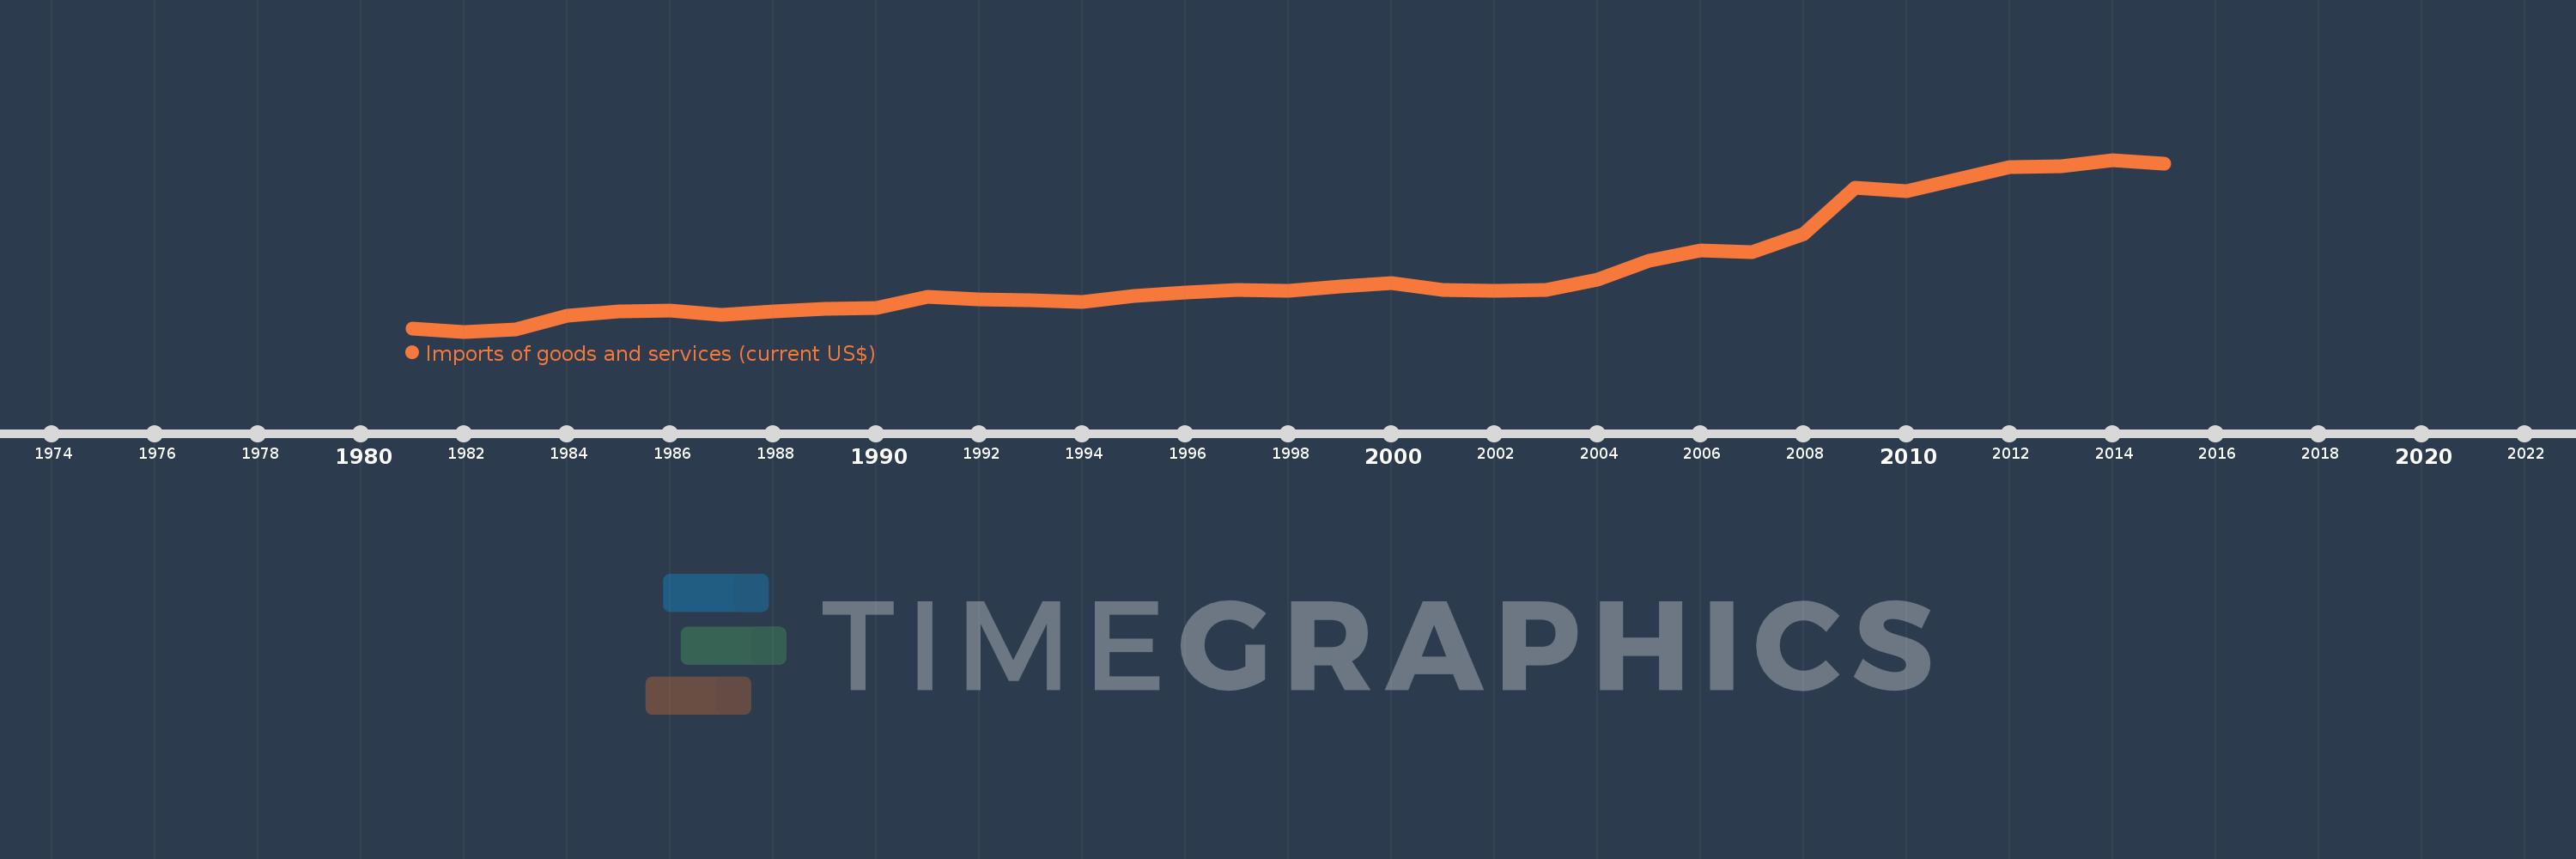
Imports of goods and services (current US$)
2015,2014,2013,2012,2011,2010,2009,2008,2007,2006,2005,2004,2003,2002,2001,2000,1999,1998,1997,1996,1995,1994,1993,1992,1991,1990,1989,1988,1987,1986,1985,1984,1983,1982,1981
This statistics in other country:
AfghanistanAlbaniaAlgeriaAngolaAntigua and BarbudaArab WorldArgentinaArmeniaArubaAustraliaAustriaAzerbaijanBahamas, TheBahrainBangladeshBarbadosBelarusBelgiumBelizeBeninBermudaBhutanBoliviaBosnia and HerzegovinaBotswanaBrazilBrunei DarussalamBulgariaBurkina FasoBurundiCabo VerdeCambodiaCameroonCanadaCaribbean small statesCentral African RepublicCentral Europe and the BalticsChadChileChinaColombiaComorosCongo, Dem. Rep.Congo, Rep.Costa RicaCote d'IvoireCroatiaCubaCyprusCzech RepublicDenmarkDjiboutiDominicaDominican RepublicEarly-demographic dividendEast Asia & PacificEast Asia & Pacific (excluding high income)East Asia & Pacific (IDA & IBRD countries)EcuadorEgypt, Arab Rep.El SalvadorEquatorial GuineaEritreaEstoniaEthiopiaEuro areaEurope & Central AsiaEurope & Central Asia (excluding high income)Europe & Central Asia (IDA & IBRD countries)European UnionFaroe IslandsFijiFinlandFragile and conflict affected situationsFranceFrench PolynesiaGabonGambia, TheGeorgiaGermanyGhanaGreeceGrenadaGuatemalaGuineaGuinea-BissauGuyanaHaitiHeavily indebted poor countries (HIPC)High incomeHondurasHong Kong SAR, ChinaHungaryIBRD onlyIcelandIDA & IBRD totalIDA blendIDA onlyIDA totalIndiaIndonesiaIran, Islamic Rep.IraqIrelandIsraelItalyJamaicaJapanJordanKazakhstanKenyaKiribatiKorea, Rep.KosovoKuwaitKyrgyz RepublicLao PDRLate-demographic dividendLatin America & Caribbean Latin America & Caribbean (excluding high income)Latin America & the Caribbean (IDA & IBRD countries)LatviaLeast developed countries: UN classificationLebanonLesothoLiberiaLibyaLithuaniaLow & middle incomeLow incomeLower middle incomeLuxembourgMacao SAR, ChinaMacedonia, FYRMadagascarMalawiMalaysiaMaldivesMaliMaltaMauritaniaMauritiusMexicoMicronesia, Fed. Sts.Middle East & North AfricaMiddle East & North Africa (excluding high income)Middle East & North Africa (IDA & IBRD countries)Middle incomeMoldovaMongoliaMontenegroMoroccoMozambiqueMyanmarNamibiaNepalNetherlandsNew CaledoniaNew ZealandNicaraguaNigerNigeriaNorth AmericaNorwayOECD membersOmanOther small statesPacific island small statesPakistanPalauPanamaPapua New GuineaParaguayPeruPhilippinesPolandPortugalPost-demographic dividendPre-demographic dividendPuerto RicoQatarRomaniaRussian FederationRwandaSamoaSaudi ArabiaSenegalSerbiaSeychellesSierra LeoneSingaporeSlovak RepublicSloveniaSmall statesSolomon IslandsSomaliaSouth AfricaSouth AsiaSouth Asia (IDA & IBRD)South SudanSpainSri LankaSt. Kitts and NevisSt. LuciaSt. Vincent and the GrenadinesSub-Saharan Africa Sub-Saharan Africa (excluding high income)Sub-Saharan Africa (IDA & IBRD countries)SudanSurinameSwazilandSwedenSwitzerlandSyrian Arab RepublicTajikistanTanzaniaThailandTimor-LesteTogoTongaTrinidad and TobagoTunisiaTurkeyTurkmenistanUgandaUkraineUnited Arab EmiratesUnited KingdomUnited StatesUpper middle incomeUruguayUzbekistanVanuatuVenezuela, RBVietnamWest Bank and GazaWorldYemen, Rep.ZambiaZimbabwe Timeline:
This timeline shows a graph from 1981 to 2015 of Vanuatu. No data until 1980. Number of actual observations by date: 35.
Source name:
World Development Indicators
Source organization:
World Bank national accounts data, and OECD National Accounts data files.
Categories, topics:
Economy & Growth, Trade
Last updated:
apr 23, 2017
Indicators value changes by year
Minimum:
40.227 mln
jan 1, 1982
Maximum:
411.286 mln
jan 1, 2014
At the date of observation
Value
Absolute change
Change from previous value
jan 1, 1981
47.385 mln
+47.385 mln
0.0%
jan 1, 1982
40.227 mln
-7.157 mln
-15.11%
jan 1, 1983
44.456 mln
+4.228 mln
10.51%
jan 1, 1984
73.724 mln
+29.269 mln
65.84%
jan 1, 1985
84.37 mln
+10.645 mln
14.44%
jan 1, 1986
85.455 mln
+1.086 mln
1.29%
jan 1, 1987
76.927 mln
-8.529 mln
-9.98%
jan 1, 1988
84.061 mln
+7.134 mln
9.27%
jan 1, 1989
89.298 mln
+5.237 mln
6.23%
jan 1, 1990
90.881 mln
+1.583 mln
1.77%
jan 1, 1991
115.539 mln
+24.658 mln
27.13%
jan 1, 1992
109.142 mln
-6.397 mln
-5.54%
jan 1, 1993
108.42 mln
-721.845K
-0.66%
jan 1, 1994
103.89 mln
-4.531 mln
-4.18%
jan 1, 1995
117.684 mln
+13.794 mln
13.28%
jan 1, 1996
124.858 mln
+7.174 mln
6.1%
jan 1, 1997
130.237 mln
+5.379 mln
4.31%
jan 1, 1998
128.981 mln
-1.257 mln
-0.96%
jan 1, 1999
137.573 mln
+8.593 mln
6.66%
jan 1, 2000
144.335 mln
+6.761 mln
4.91%
jan 1, 2001
130.504 mln
-13.831 mln
-9.58%
jan 1, 2002
128.489 mln
-2.015 mln
-1.54%
jan 1, 2003
129.693 mln
+1.204 mln
0.94%
jan 1, 2004
151.863 mln
+22.17 mln
17.09%
jan 1, 2005
193.837 mln
+41.974 mln
27.64%
jan 1, 2006
216.402 mln
+22.565 mln
11.64%
jan 1, 2007
212.074 mln
-4.328 mln
-2.0%
jan 1, 2008
250.885 mln
+38.811 mln
18.3%
jan 1, 2009
350.296 mln
+99.412 mln
39.62%
jan 1, 2010
343.327 mln
-6.969 mln
-1.99%
jan 1, 2011
369.596 mln
+26.269 mln
7.65%
jan 1, 2012
395.801 mln
+26.205 mln
7.09%
jan 1, 2013
397.409 mln
+1.608 mln
0.41%
jan 1, 2014
411.286 mln
+13.877 mln
3.49%
jan 1, 2015
402.517 mln
-8.769 mln
-2.13%
Ranking of countries by current statistics by years


Comments: