29
/
en
AIzaSyAYiBZKx7MnpbEhh9jyipgxe19OcubqV5w
April 1, 2024
139390
Germany
DEU
true
2
1
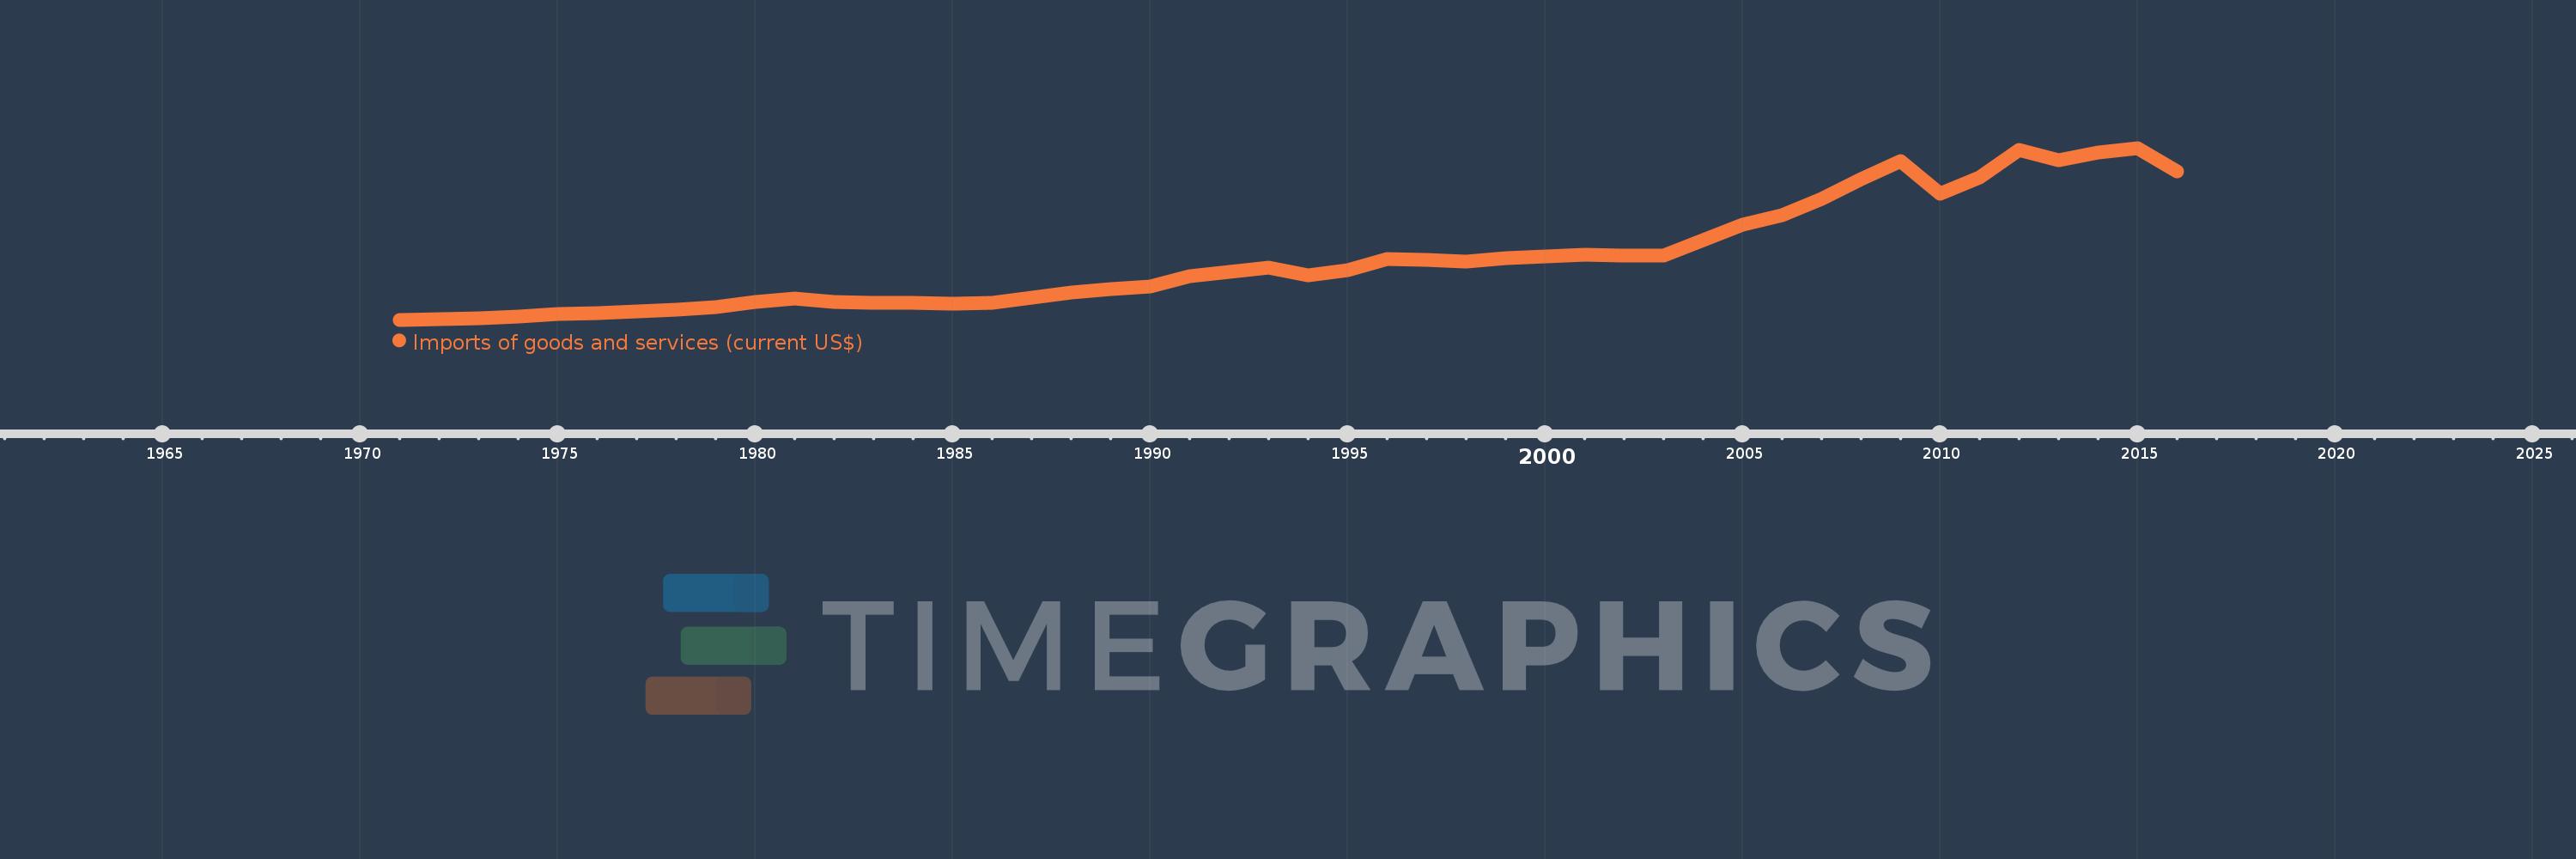
Imports of goods and services (current US$)
2016,2015,2014,2013,2012,2011,2010,2009,2008,2007,2006,2005,2004,2003,2002,2001,2000,1999,1998,1997,1996,1995,1994,1993,1992,1991,1990,1989,1988,1987,1986,1985,1984,1983,1982,1981,1980,1979,1978,1977,1976,1975,1974,1973,1972,1971
This statistics in other country:
AfghanistanAlbaniaAlgeriaAngolaAntigua and BarbudaArab WorldArgentinaArmeniaArubaAustraliaAustriaAzerbaijanBahamas, TheBahrainBangladeshBarbadosBelarusBelgiumBelizeBeninBermudaBhutanBoliviaBosnia and HerzegovinaBotswanaBrazilBrunei DarussalamBulgariaBurkina FasoBurundiCabo VerdeCambodiaCameroonCanadaCaribbean small statesCentral African RepublicCentral Europe and the BalticsChadChileChinaColombiaComorosCongo, Dem. Rep.Congo, Rep.Costa RicaCote d'IvoireCroatiaCubaCyprusCzech RepublicDenmarkDjiboutiDominicaDominican RepublicEarly-demographic dividendEast Asia & PacificEast Asia & Pacific (excluding high income)East Asia & Pacific (IDA & IBRD countries)EcuadorEgypt, Arab Rep.El SalvadorEquatorial GuineaEritreaEstoniaEthiopiaEuro areaEurope & Central AsiaEurope & Central Asia (excluding high income)Europe & Central Asia (IDA & IBRD countries)European UnionFaroe IslandsFijiFinlandFragile and conflict affected situationsFranceFrench PolynesiaGabonGambia, TheGeorgiaGermanyGhanaGreeceGrenadaGuatemalaGuineaGuinea-BissauGuyanaHaitiHeavily indebted poor countries (HIPC)High incomeHondurasHong Kong SAR, ChinaHungaryIBRD onlyIcelandIDA & IBRD totalIDA blendIDA onlyIDA totalIndiaIndonesiaIran, Islamic Rep.IraqIrelandIsraelItalyJamaicaJapanJordanKazakhstanKenyaKiribatiKorea, Rep.KosovoKuwaitKyrgyz RepublicLao PDRLate-demographic dividendLatin America & Caribbean Latin America & Caribbean (excluding high income)Latin America & the Caribbean (IDA & IBRD countries)LatviaLeast developed countries: UN classificationLebanonLesothoLiberiaLibyaLithuaniaLow & middle incomeLow incomeLower middle incomeLuxembourgMacao SAR, ChinaMacedonia, FYRMadagascarMalawiMalaysiaMaldivesMaliMaltaMauritaniaMauritiusMexicoMicronesia, Fed. Sts.Middle East & North AfricaMiddle East & North Africa (excluding high income)Middle East & North Africa (IDA & IBRD countries)Middle incomeMoldovaMongoliaMontenegroMoroccoMozambiqueMyanmarNamibiaNepalNetherlandsNew CaledoniaNew ZealandNicaraguaNigerNigeriaNorth AmericaNorwayOECD membersOmanOther small statesPacific island small statesPakistanPalauPanamaPapua New GuineaParaguayPeruPhilippinesPolandPortugalPost-demographic dividendPre-demographic dividendPuerto RicoQatarRomaniaRussian FederationRwandaSamoaSaudi ArabiaSenegalSerbiaSeychellesSierra LeoneSingaporeSlovak RepublicSloveniaSmall statesSolomon IslandsSomaliaSouth AfricaSouth AsiaSouth Asia (IDA & IBRD)South SudanSpainSri LankaSt. Kitts and NevisSt. LuciaSt. Vincent and the GrenadinesSub-Saharan Africa Sub-Saharan Africa (excluding high income)Sub-Saharan Africa (IDA & IBRD countries)SudanSurinameSwazilandSwedenSwitzerlandSyrian Arab RepublicTajikistanTanzaniaThailandTimor-LesteTogoTongaTrinidad and TobagoTunisiaTurkeyTurkmenistanUgandaUkraineUnited Arab EmiratesUnited KingdomUnited StatesUpper middle incomeUruguayUzbekistanVanuatuVenezuela, RBVietnamWest Bank and GazaWorldYemen, Rep.ZambiaZimbabwe Timeline:
This timeline shows a graph from 1971 to 2016 of Germany. No data until 1970. Number of actual observations by date: 46.
Source name:
World Development Indicators
Source organization:
World Bank national accounts data, and OECD National Accounts data files.
Categories, topics:
Economy & Growth, Trade
Last updated:
apr 23, 2017
Indicators value changes by year
Minimum:
35.792 bln
jan 1, 1971
Maximum:
1.518 trl
jan 1, 2015
At the date of observation
Value
Absolute change
Change from previous value
jan 1, 1971
35.792 bln
+35.792 bln
0.0%
jan 1, 1972
40.707 bln
+4.916 bln
13.73%
jan 1, 1973
48.508 bln
+7.8 bln
19.16%
jan 1, 1974
65.127 bln
+16.62 bln
34.26%
jan 1, 1975
83.344 bln
+18.217 bln
27.97%
jan 1, 1976
92.223 bln
+8.879 bln
10.65%
jan 1, 1977
105.504 bln
+13.281 bln
14.4%
jan 1, 1978
120.847 bln
+15.343 bln
14.54%
jan 1, 1979
144.719 bln
+23.873 bln
19.75%
jan 1, 1980
188.611 bln
+43.892 bln
30.33%
jan 1, 1981
220.784 bln
+32.173 bln
17.06%
jan 1, 1982
192.504 bln
-28.28 bln
-12.81%
jan 1, 1983
182.638 bln
-9.866 bln
-5.13%
jan 1, 1984
179.451 bln
-3.187 bln
-1.74%
jan 1, 1985
177.78 bln
-1.671 bln
-0.93%
jan 1, 1986
182.964 bln
+5.184 bln
2.92%
jan 1, 1987
226.598 bln
+43.634 bln
23.85%
jan 1, 1988
272.706 bln
+46.108 bln
20.35%
jan 1, 1989
300.381 bln
+27.674 bln
10.15%
jan 1, 1990
320.598 bln
+20.218 bln
6.73%
jan 1, 1991
407.985 bln
+87.386 bln
27.26%
jan 1, 1992
451.406 bln
+43.421 bln
10.64%
jan 1, 1993
483.783 bln
+32.377 bln
7.17%
jan 1, 1994
419.708 bln
-64.076 bln
-13.24%
jan 1, 1995
461.884 bln
+42.176 bln
10.05%
jan 1, 1996
558.19 bln
+96.306 bln
20.85%
jan 1, 1997
553.013 bln
-5.178 bln
-0.93%
jan 1, 1998
537.124 bln
-15.889 bln
-2.87%
jan 1, 1999
563.711 bln
+26.587 bln
4.95%
jan 1, 2000
579.209 bln
+15.498 bln
2.75%
jan 1, 2001
595.915 bln
+16.705 bln
2.88%
jan 1, 2002
587.284 bln
-8.631 bln
-1.45%
jan 1, 2003
586.295 bln
-989.179 mln
-0.17%
jan 1, 2004
724.85 bln
+138.555 bln
23.63%
jan 1, 2005
857.267 bln
+132.417 bln
18.27%
jan 1, 2006
935.13 bln
+77.863 bln
9.08%
jan 1, 2007
1.078 trl
+142.503 bln
15.24%
jan 1, 2008
1.251 trl
+173.156 bln
16.07%
jan 1, 2009
1.407 trl
+155.787 bln
12.46%
jan 1, 2010
1.123 trl
-283.322 bln
-20.14%
jan 1, 2011
1.266 trl
+142.948 bln
12.73%
jan 1, 2012
1.5 trl
+234.138 bln
18.49%
jan 1, 2013
1.414 trl
-86.566 bln
-5.77%
jan 1, 2014
1.482 trl
+68.453 bln
4.84%
jan 1, 2015
1.518 trl
+35.697 bln
2.41%
jan 1, 2016
1.319 trl
-199.026 bln
-13.11%
Ranking of countries by current statistics by years


Comments: