29
/
en
AIzaSyAYiBZKx7MnpbEhh9jyipgxe19OcubqV5w
April 1, 2024
32699
Europe & Central Asia (IDA & IBRD countries)
TEC
false
2
1
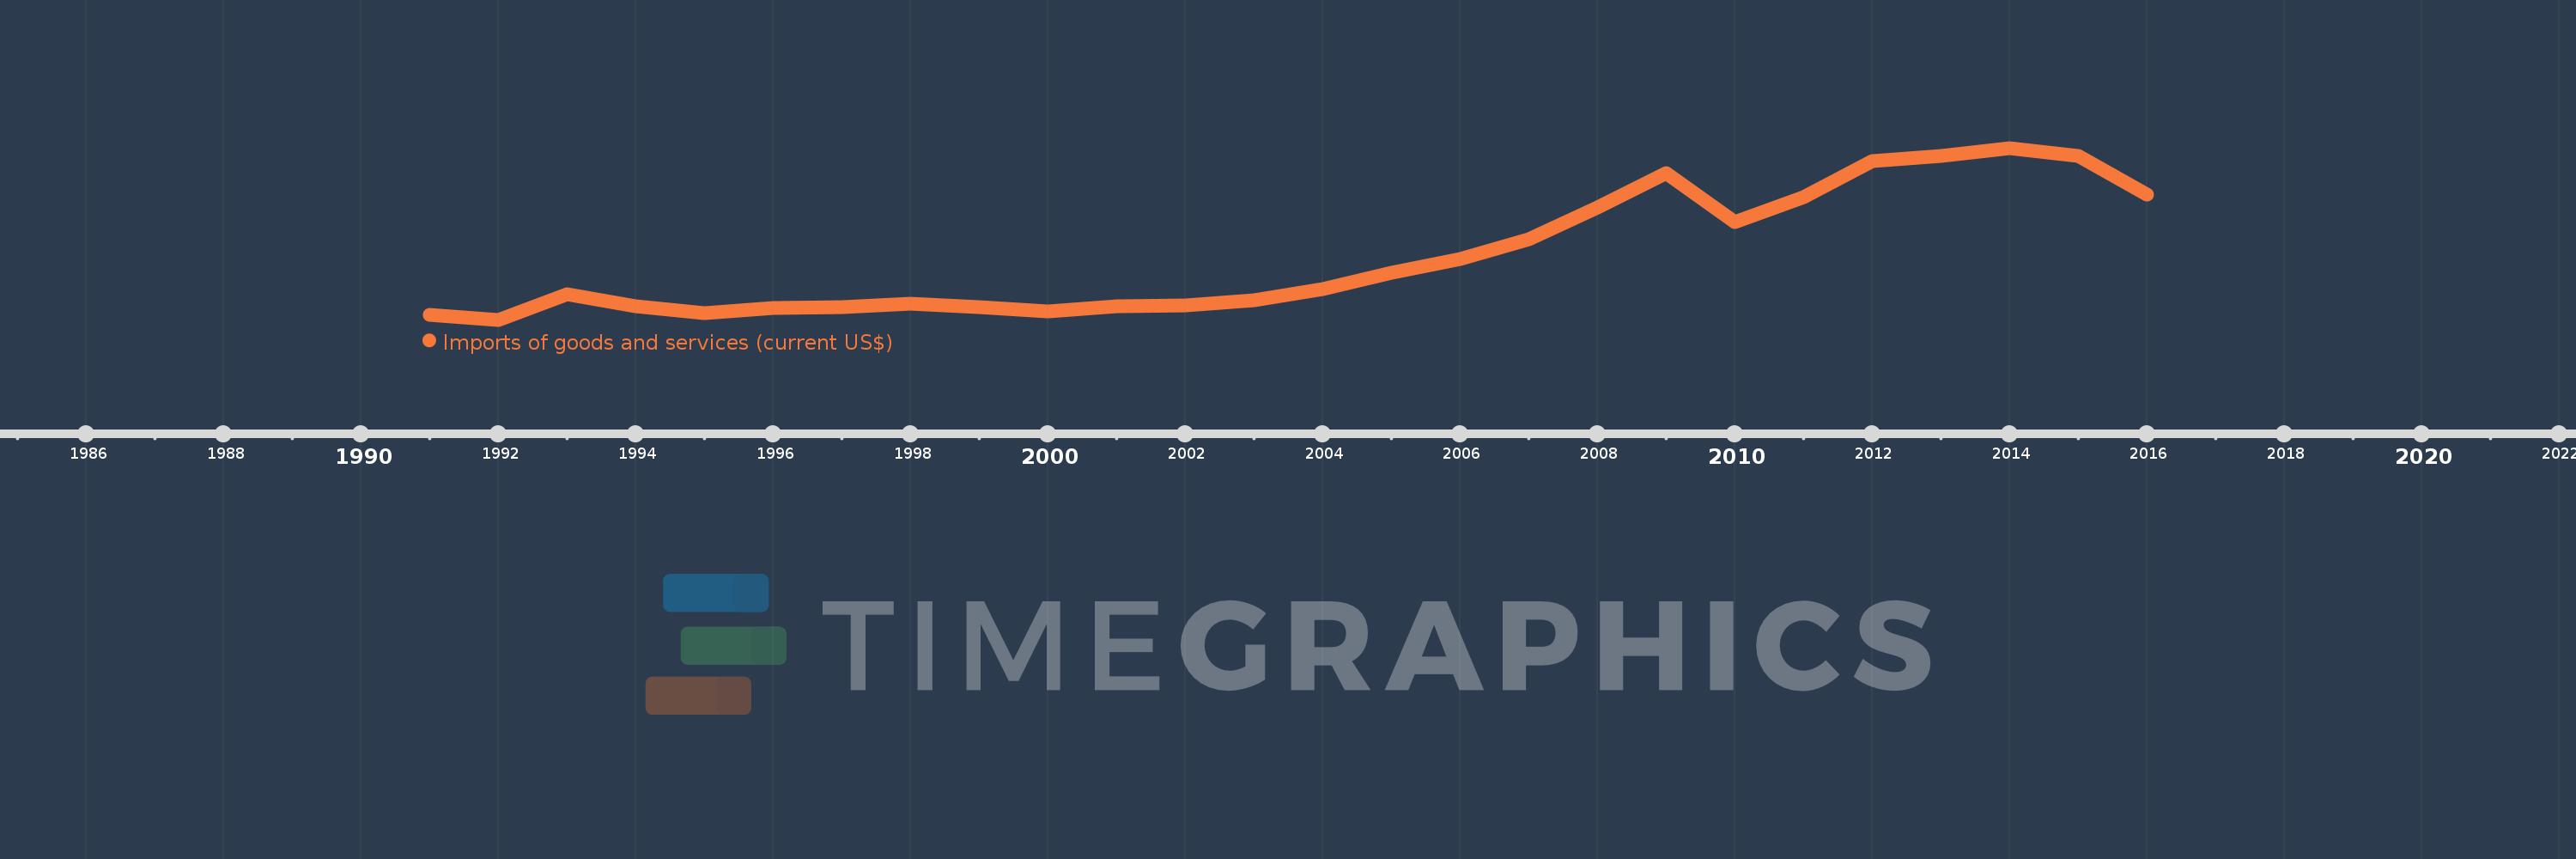
Imports of goods and services (current US$)
2016,2015,2014,2013,2012,2011,2010,2009,2008,2007,2006,2005,2004,2003,2002,2001,2000,1999,1998,1997,1996,1995,1994,1993,1992,1991
This statistics in other country:
AfghanistanAlbaniaAlgeriaAngolaAntigua and BarbudaArab WorldArgentinaArmeniaArubaAustraliaAustriaAzerbaijanBahamas, TheBahrainBangladeshBarbadosBelarusBelgiumBelizeBeninBermudaBhutanBoliviaBosnia and HerzegovinaBotswanaBrazilBrunei DarussalamBulgariaBurkina FasoBurundiCabo VerdeCambodiaCameroonCanadaCaribbean small statesCentral African RepublicCentral Europe and the BalticsChadChileChinaColombiaComorosCongo, Dem. Rep.Congo, Rep.Costa RicaCote d'IvoireCroatiaCubaCyprusCzech RepublicDenmarkDjiboutiDominicaDominican RepublicEarly-demographic dividendEast Asia & PacificEast Asia & Pacific (excluding high income)East Asia & Pacific (IDA & IBRD countries)EcuadorEgypt, Arab Rep.El SalvadorEquatorial GuineaEritreaEstoniaEthiopiaEuro areaEurope & Central AsiaEurope & Central Asia (excluding high income)Europe & Central Asia (IDA & IBRD countries)European UnionFaroe IslandsFijiFinlandFragile and conflict affected situationsFranceFrench PolynesiaGabonGambia, TheGeorgiaGermanyGhanaGreeceGrenadaGuatemalaGuineaGuinea-BissauGuyanaHaitiHeavily indebted poor countries (HIPC)High incomeHondurasHong Kong SAR, ChinaHungaryIBRD onlyIcelandIDA & IBRD totalIDA blendIDA onlyIDA totalIndiaIndonesiaIran, Islamic Rep.IraqIrelandIsraelItalyJamaicaJapanJordanKazakhstanKenyaKiribatiKorea, Rep.KosovoKuwaitKyrgyz RepublicLao PDRLate-demographic dividendLatin America & Caribbean Latin America & Caribbean (excluding high income)Latin America & the Caribbean (IDA & IBRD countries)LatviaLeast developed countries: UN classificationLebanonLesothoLiberiaLibyaLithuaniaLow & middle incomeLow incomeLower middle incomeLuxembourgMacao SAR, ChinaMacedonia, FYRMadagascarMalawiMalaysiaMaldivesMaliMaltaMauritaniaMauritiusMexicoMicronesia, Fed. Sts.Middle East & North AfricaMiddle East & North Africa (excluding high income)Middle East & North Africa (IDA & IBRD countries)Middle incomeMoldovaMongoliaMontenegroMoroccoMozambiqueMyanmarNamibiaNepalNetherlandsNew CaledoniaNew ZealandNicaraguaNigerNigeriaNorth AmericaNorwayOECD membersOmanOther small statesPacific island small statesPakistanPalauPanamaPapua New GuineaParaguayPeruPhilippinesPolandPortugalPost-demographic dividendPre-demographic dividendPuerto RicoQatarRomaniaRussian FederationRwandaSamoaSaudi ArabiaSenegalSerbiaSeychellesSierra LeoneSingaporeSlovak RepublicSloveniaSmall statesSolomon IslandsSomaliaSouth AfricaSouth AsiaSouth Asia (IDA & IBRD)South SudanSpainSri LankaSt. Kitts and NevisSt. LuciaSt. Vincent and the GrenadinesSub-Saharan Africa Sub-Saharan Africa (excluding high income)Sub-Saharan Africa (IDA & IBRD countries)SudanSurinameSwazilandSwedenSwitzerlandSyrian Arab RepublicTajikistanTanzaniaThailandTimor-LesteTogoTongaTrinidad and TobagoTunisiaTurkeyTurkmenistanUgandaUkraineUnited Arab EmiratesUnited KingdomUnited StatesUpper middle incomeUruguayUzbekistanVanuatuVenezuela, RBVietnamWest Bank and GazaWorldYemen, Rep.ZambiaZimbabwe Timeline:
This timeline shows a graph from 1991 to 2016 of Europe & Central Asia (IDA & IBRD countries). No data until 1990. Number of actual observations by date: 26.
Source name:
World Development Indicators
Source organization:
World Bank national accounts data, and OECD National Accounts data files.
Categories, topics:
Economy & Growth, Trade
Last updated:
apr 23, 2017
Indicators value changes by year
Minimum:
169.535 bln
jan 1, 1992
Maximum:
1.451 trl
jan 1, 2014
At the date of observation
Value
Absolute change
Change from previous value
jan 1, 1991
207.775 bln
+207.775 bln
0.0%
jan 1, 1992
169.535 bln
-38.24 bln
-18.4%
jan 1, 1993
362.933 bln
+193.398 bln
114.08%
jan 1, 1994
270.415 bln
-92.518 bln
-25.49%
jan 1, 1995
220.31 bln
-50.105 bln
-18.53%
jan 1, 1996
260.467 bln
+40.158 bln
18.23%
jan 1, 1997
261.339 bln
+871.273 mln
0.33%
jan 1, 1998
286.297 bln
+24.959 bln
9.55%
jan 1, 1999
264.35 bln
-21.948 bln
-7.67%
jan 1, 2000
229.472 bln
-34.878 bln
-13.19%
jan 1, 2001
267.602 bln
+38.13 bln
16.62%
jan 1, 2002
277.164 bln
+9.561 bln
3.57%
jan 1, 2003
314.117 bln
+36.953 bln
13.33%
jan 1, 2004
397.989 bln
+83.872 bln
26.7%
jan 1, 2005
517.507 bln
+119.518 bln
30.03%
jan 1, 2006
619.697 bln
+102.19 bln
19.75%
jan 1, 2007
768.439 bln
+148.743 bln
24.0%
jan 1, 2008
1.009 trl
+240.086 bln
31.24%
jan 1, 2009
1.265 trl
+256.314 bln
25.41%
jan 1, 2010
895.141 bln
-369.699 bln
-29.23%
jan 1, 2011
1.084 trl
+188.645 bln
21.07%
jan 1, 2012
1.353 trl
+269.339 bln
24.85%
jan 1, 2013
1.389 trl
+36.01 bln
2.66%
jan 1, 2014
1.451 trl
+62.006 bln
4.46%
jan 1, 2015
1.393 trl
-58.312 bln
-4.02%
jan 1, 2016
1.101 trl
-292.144 bln
-20.97%
Ranking of countries by current statistics by years


Comments: