29
/
en
AIzaSyAYiBZKx7MnpbEhh9jyipgxe19OcubqV5w
April 1, 2024
37443
IDA & IBRD total
IBT
false
2
1
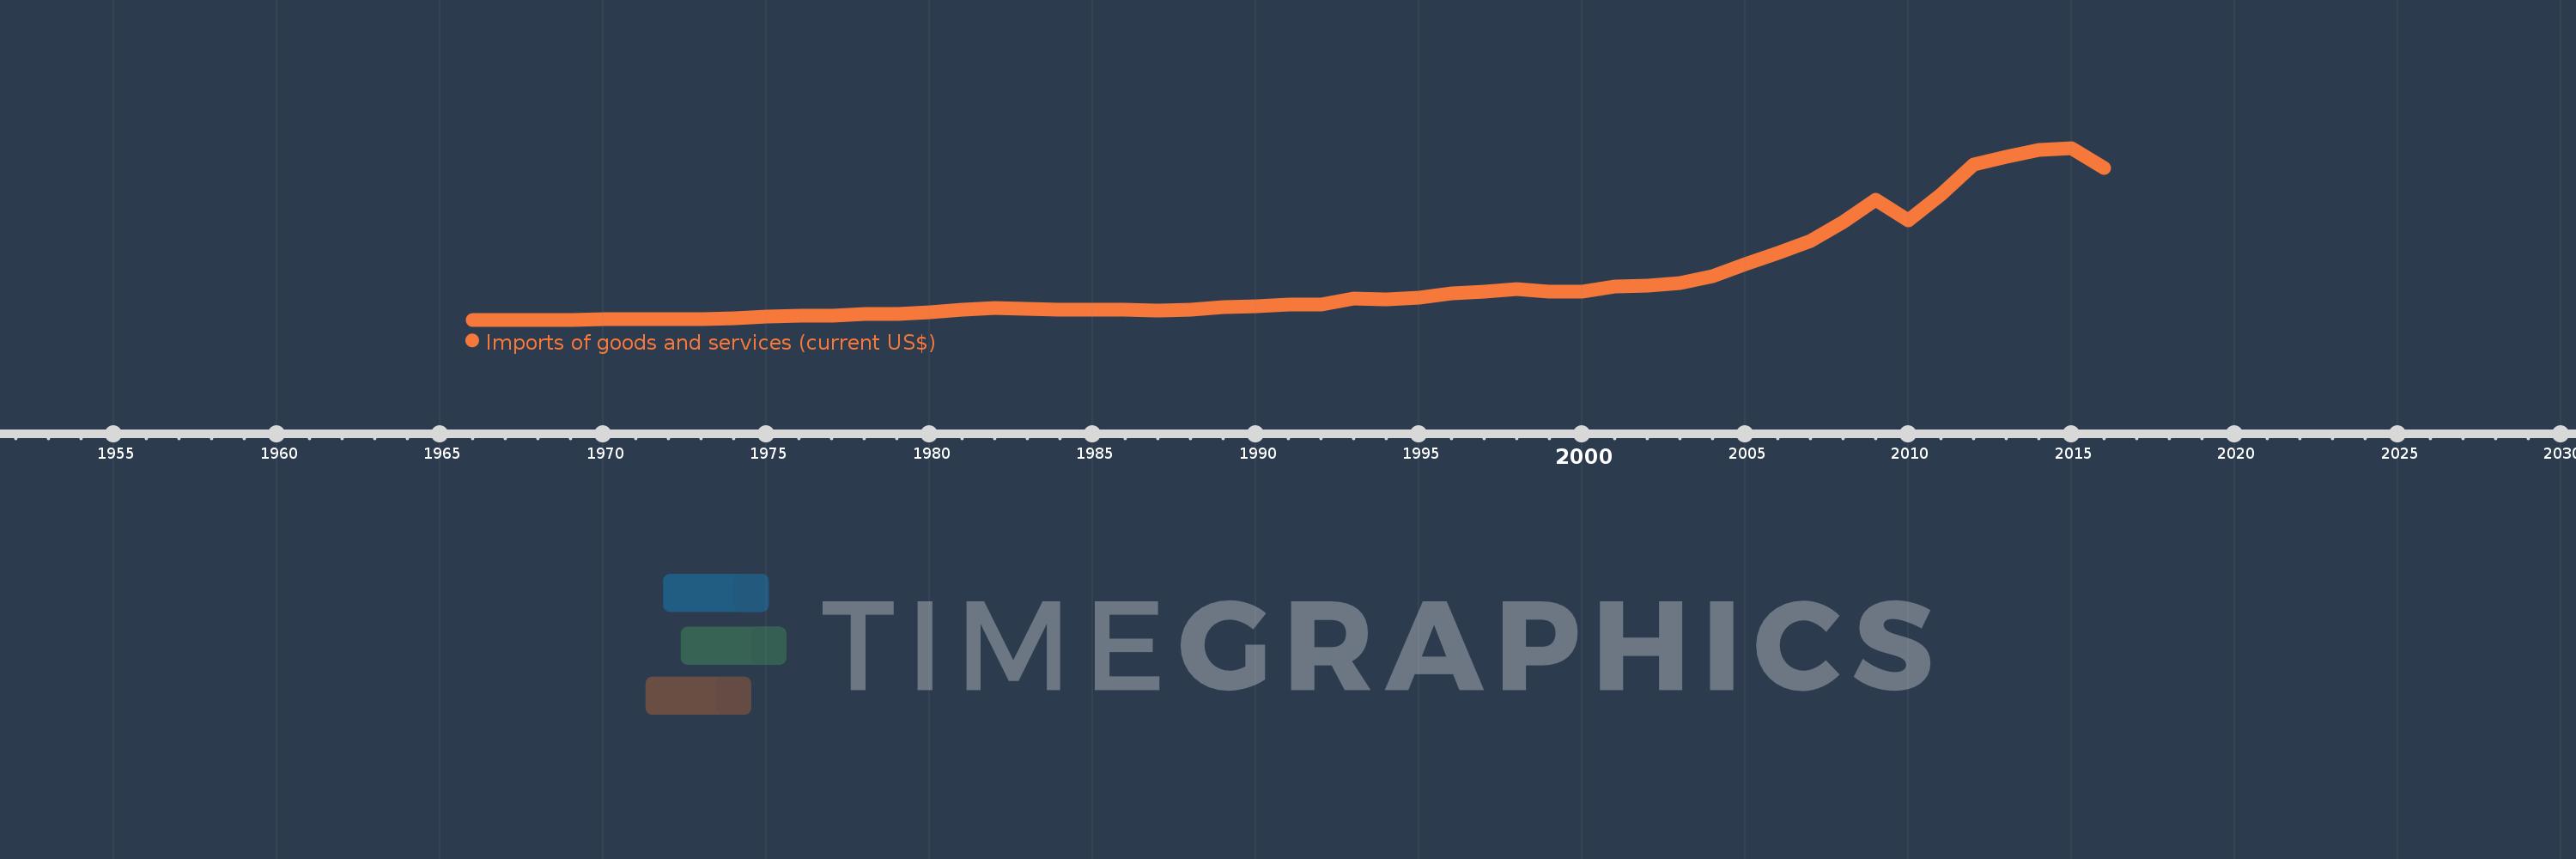
Imports of goods and services (current US$)
2016,2015,2014,2013,2012,2011,2010,2009,2008,2007,2006,2005,2004,2003,2002,2001,2000,1999,1998,1997,1996,1995,1994,1993,1992,1991,1990,1989,1988,1987,1986,1985,1984,1983,1982,1981,1980,1979,1978,1977,1976,1975,1974,1973,1972,1971,1970,1969,1968,1967,1966
This statistics in other country:
AfghanistanAlbaniaAlgeriaAngolaAntigua and BarbudaArab WorldArgentinaArmeniaArubaAustraliaAustriaAzerbaijanBahamas, TheBahrainBangladeshBarbadosBelarusBelgiumBelizeBeninBermudaBhutanBoliviaBosnia and HerzegovinaBotswanaBrazilBrunei DarussalamBulgariaBurkina FasoBurundiCabo VerdeCambodiaCameroonCanadaCaribbean small statesCentral African RepublicCentral Europe and the BalticsChadChileChinaColombiaComorosCongo, Dem. Rep.Congo, Rep.Costa RicaCote d'IvoireCroatiaCubaCyprusCzech RepublicDenmarkDjiboutiDominicaDominican RepublicEarly-demographic dividendEast Asia & PacificEast Asia & Pacific (excluding high income)East Asia & Pacific (IDA & IBRD countries)EcuadorEgypt, Arab Rep.El SalvadorEquatorial GuineaEritreaEstoniaEthiopiaEuro areaEurope & Central AsiaEurope & Central Asia (excluding high income)Europe & Central Asia (IDA & IBRD countries)European UnionFaroe IslandsFijiFinlandFragile and conflict affected situationsFranceFrench PolynesiaGabonGambia, TheGeorgiaGermanyGhanaGreeceGrenadaGuatemalaGuineaGuinea-BissauGuyanaHaitiHeavily indebted poor countries (HIPC)High incomeHondurasHong Kong SAR, ChinaHungaryIBRD onlyIcelandIDA & IBRD totalIDA blendIDA onlyIDA totalIndiaIndonesiaIran, Islamic Rep.IraqIrelandIsraelItalyJamaicaJapanJordanKazakhstanKenyaKiribatiKorea, Rep.KosovoKuwaitKyrgyz RepublicLao PDRLate-demographic dividendLatin America & Caribbean Latin America & Caribbean (excluding high income)Latin America & the Caribbean (IDA & IBRD countries)LatviaLeast developed countries: UN classificationLebanonLesothoLiberiaLibyaLithuaniaLow & middle incomeLow incomeLower middle incomeLuxembourgMacao SAR, ChinaMacedonia, FYRMadagascarMalawiMalaysiaMaldivesMaliMaltaMauritaniaMauritiusMexicoMicronesia, Fed. Sts.Middle East & North AfricaMiddle East & North Africa (excluding high income)Middle East & North Africa (IDA & IBRD countries)Middle incomeMoldovaMongoliaMontenegroMoroccoMozambiqueMyanmarNamibiaNepalNetherlandsNew CaledoniaNew ZealandNicaraguaNigerNigeriaNorth AmericaNorwayOECD membersOmanOther small statesPacific island small statesPakistanPalauPanamaPapua New GuineaParaguayPeruPhilippinesPolandPortugalPost-demographic dividendPre-demographic dividendPuerto RicoQatarRomaniaRussian FederationRwandaSamoaSaudi ArabiaSenegalSerbiaSeychellesSierra LeoneSingaporeSlovak RepublicSloveniaSmall statesSolomon IslandsSomaliaSouth AfricaSouth AsiaSouth Asia (IDA & IBRD)South SudanSpainSri LankaSt. Kitts and NevisSt. LuciaSt. Vincent and the GrenadinesSub-Saharan Africa Sub-Saharan Africa (excluding high income)Sub-Saharan Africa (IDA & IBRD countries)SudanSurinameSwazilandSwedenSwitzerlandSyrian Arab RepublicTajikistanTanzaniaThailandTimor-LesteTogoTongaTrinidad and TobagoTunisiaTurkeyTurkmenistanUgandaUkraineUnited Arab EmiratesUnited KingdomUnited StatesUpper middle incomeUruguayUzbekistanVanuatuVenezuela, RBVietnamWest Bank and GazaWorldYemen, Rep.ZambiaZimbabwe Timeline:
This timeline shows a graph from 1966 to 2016 of IDA & IBRD total. No data until 1965. Number of actual observations by date: 51.
Source name:
World Development Indicators
Source organization:
World Bank national accounts data, and OECD National Accounts data files.
Categories, topics:
Economy & Growth, Trade
Last updated:
apr 23, 2017
Indicators value changes by year
Minimum:
53.3 bln
jan 1, 1966
Maximum:
7.693 trl
jan 1, 2015
At the date of observation
Value
Absolute change
Change from previous value
jan 1, 1966
53.3 bln
+53.3 bln
0.0%
jan 1, 1967
55.93 bln
+2.63 bln
4.93%
jan 1, 1968
58.317 bln
+2.387 bln
4.27%
jan 1, 1969
60.867 bln
+2.55 bln
4.37%
jan 1, 1970
65.601 bln
+4.734 bln
7.78%
jan 1, 1971
74.731 bln
+9.13 bln
13.92%
jan 1, 1972
80.825 bln
+6.094 bln
8.15%
jan 1, 1973
90.626 bln
+9.801 bln
12.13%
jan 1, 1974
122.487 bln
+31.861 bln
35.16%
jan 1, 1975
196.673 bln
+74.186 bln
60.57%
jan 1, 1976
237.53 bln
+40.857 bln
20.77%
jan 1, 1977
251.923 bln
+14.393 bln
6.06%
jan 1, 1978
290.209 bln
+38.286 bln
15.2%
jan 1, 1979
310.605 bln
+20.396 bln
7.03%
jan 1, 1980
377.341 bln
+66.736 bln
21.49%
jan 1, 1981
501.436 bln
+124.095 bln
32.89%
jan 1, 1982
569.424 bln
+67.988 bln
13.56%
jan 1, 1983
530.744 bln
-38.68 bln
-6.79%
jan 1, 1984
492.478 bln
-38.266 bln
-7.21%
jan 1, 1985
483.255 bln
-9.223 bln
-1.87%
jan 1, 1986
492.969 bln
+9.714 bln
2.01%
jan 1, 1987
479.656 bln
-13.313 bln
-2.7%
jan 1, 1988
514.002 bln
+34.346 bln
7.16%
jan 1, 1989
609.518 bln
+95.516 bln
18.58%
jan 1, 1990
660.522 bln
+51.003 bln
8.37%
jan 1, 1991
710.588 bln
+50.067 bln
7.58%
jan 1, 1992
739.43 bln
+28.841 bln
4.06%
jan 1, 1993
987.902 bln
+248.472 bln
33.6%
jan 1, 1994
962.431 bln
-25.47 bln
-2.58%
jan 1, 1995
1.017 trl
+54.218 bln
5.63%
jan 1, 1996
1.208 trl
+191.222 bln
18.81%
jan 1, 1997
1.303 trl
+95.519 bln
7.91%
jan 1, 1998
1.401 trl
+97.601 bln
7.49%
jan 1, 1999
1.321 trl
-80.0 bln
-5.71%
jan 1, 2000
1.31 trl
-11.456 bln
-0.87%
jan 1, 2001
1.54 trl
+230.645 bln
17.61%
jan 1, 2002
1.567 trl
+26.815 bln
1.74%
jan 1, 2003
1.672 trl
+105.474 bln
6.73%
jan 1, 2004
1.994 trl
+321.996 bln
19.25%
jan 1, 2005
2.53 trl
+535.358 bln
26.84%
jan 1, 2006
3.004 trl
+473.855 bln
18.73%
jan 1, 2007
3.57 trl
+566.237 bln
18.85%
jan 1, 2008
4.399 trl
+828.857 bln
23.22%
jan 1, 2009
5.376 trl
+977.307 bln
22.22%
jan 1, 2010
4.468 trl
-908.52 bln
-16.9%
jan 1, 2011
5.618 trl
+1.151 trl
25.76%
jan 1, 2012
6.942 trl
+1.324 trl
23.56%
jan 1, 2013
7.312 trl
+369.194 bln
5.32%
jan 1, 2014
7.605 trl
+293.276 bln
4.01%
jan 1, 2015
7.693 trl
+88.301 bln
1.16%
jan 1, 2016
6.787 trl
-905.885 bln
-11.78%
Ranking of countries by current statistics by years


Comments: