29
/
en
AIzaSyAYiBZKx7MnpbEhh9jyipgxe19OcubqV5w
April 1, 2024
182200
Luxembourg
LUX
true
2
1
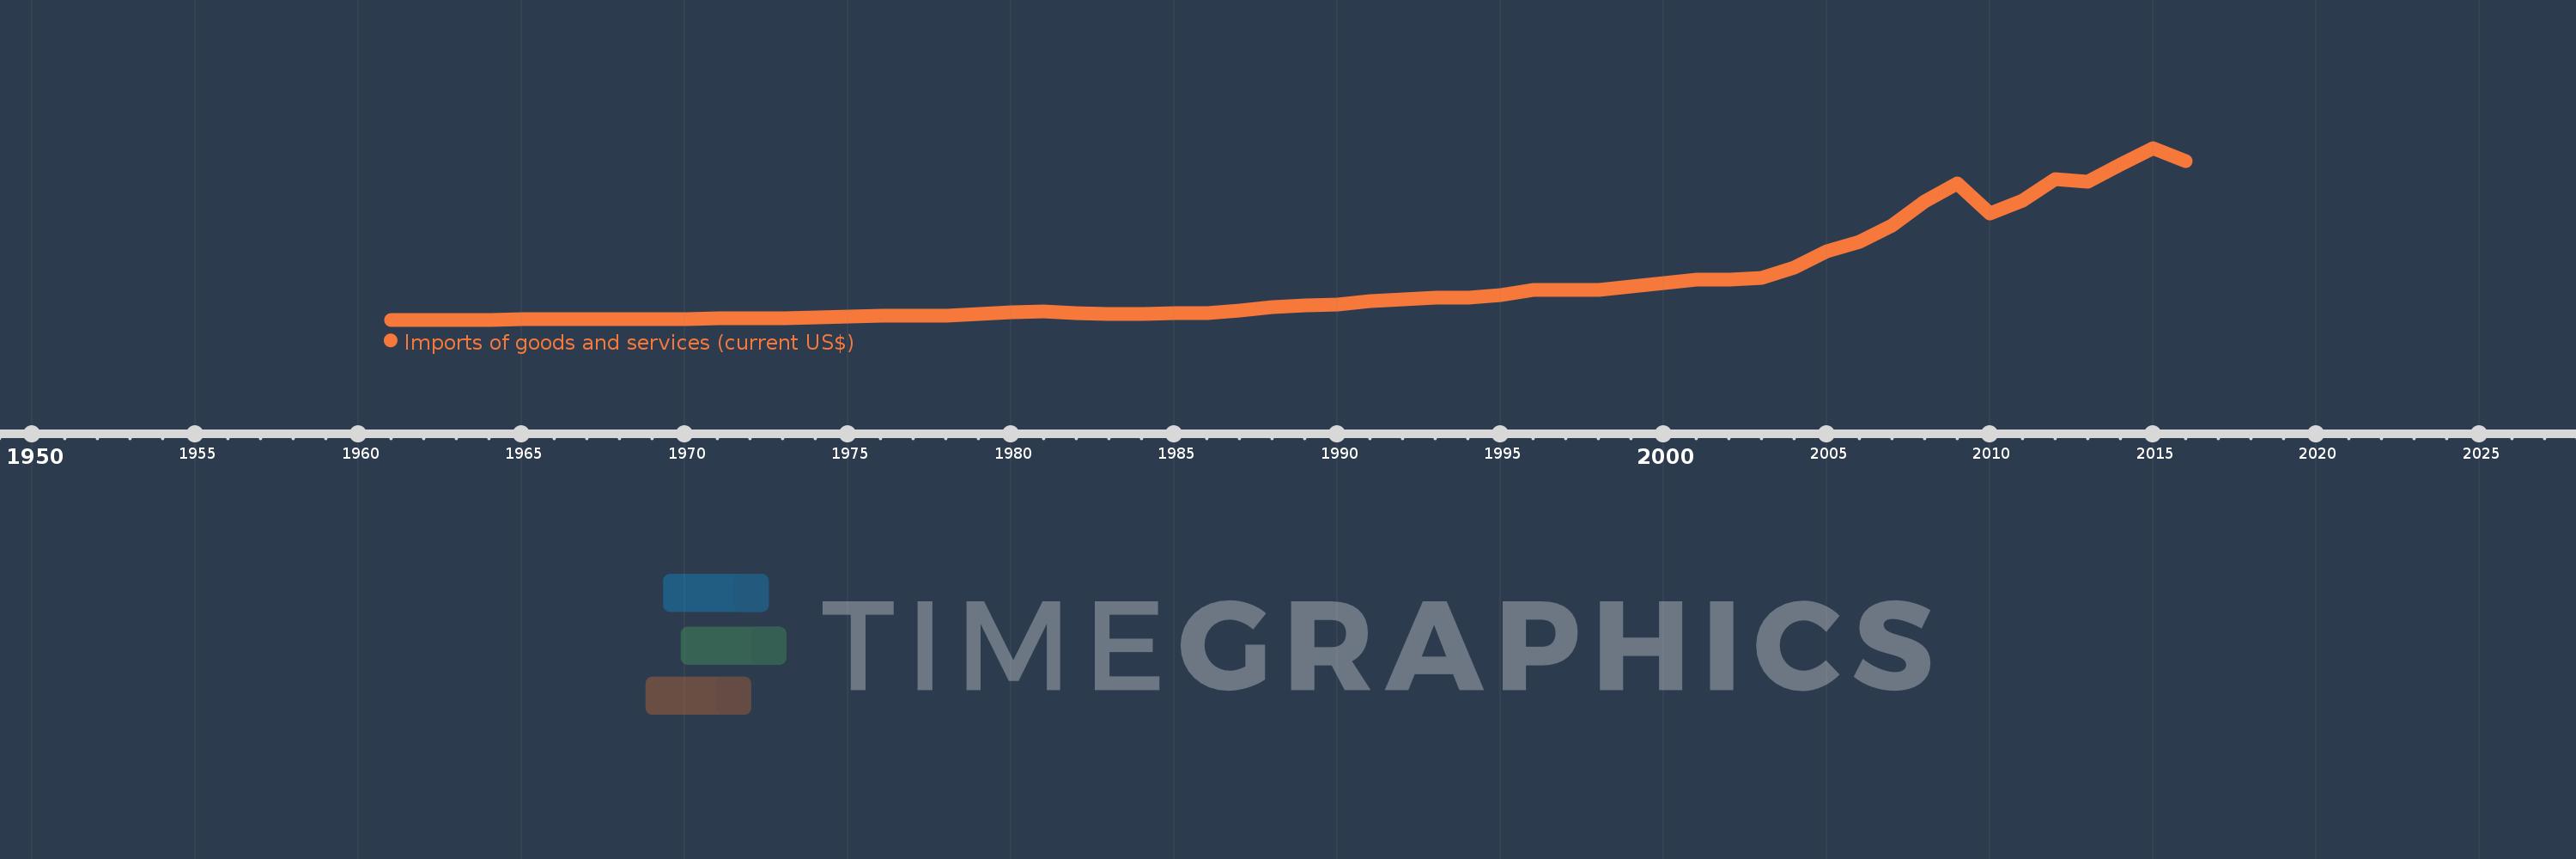
Imports of goods and services (current US$)
2016,2015,2014,2013,2012,2011,2010,2009,2008,2007,2006,2005,2004,2003,2002,2001,2000,1999,1998,1997,1996,1995,1994,1993,1992,1991,1990,1989,1988,1987,1986,1985,1984,1983,1982,1981,1980,1979,1978,1977,1976,1975,1974,1973,1972,1971,1970,1969,1968,1967,1966,1965,1964,1963,1962,1961
This statistics in other country:
AfghanistanAlbaniaAlgeriaAngolaAntigua and BarbudaArab WorldArgentinaArmeniaArubaAustraliaAustriaAzerbaijanBahamas, TheBahrainBangladeshBarbadosBelarusBelgiumBelizeBeninBermudaBhutanBoliviaBosnia and HerzegovinaBotswanaBrazilBrunei DarussalamBulgariaBurkina FasoBurundiCabo VerdeCambodiaCameroonCanadaCaribbean small statesCentral African RepublicCentral Europe and the BalticsChadChileChinaColombiaComorosCongo, Dem. Rep.Congo, Rep.Costa RicaCote d'IvoireCroatiaCubaCyprusCzech RepublicDenmarkDjiboutiDominicaDominican RepublicEarly-demographic dividendEast Asia & PacificEast Asia & Pacific (excluding high income)East Asia & Pacific (IDA & IBRD countries)EcuadorEgypt, Arab Rep.El SalvadorEquatorial GuineaEritreaEstoniaEthiopiaEuro areaEurope & Central AsiaEurope & Central Asia (excluding high income)Europe & Central Asia (IDA & IBRD countries)European UnionFaroe IslandsFijiFinlandFragile and conflict affected situationsFranceFrench PolynesiaGabonGambia, TheGeorgiaGermanyGhanaGreeceGrenadaGuatemalaGuineaGuinea-BissauGuyanaHaitiHeavily indebted poor countries (HIPC)High incomeHondurasHong Kong SAR, ChinaHungaryIBRD onlyIcelandIDA & IBRD totalIDA blendIDA onlyIDA totalIndiaIndonesiaIran, Islamic Rep.IraqIrelandIsraelItalyJamaicaJapanJordanKazakhstanKenyaKiribatiKorea, Rep.KosovoKuwaitKyrgyz RepublicLao PDRLate-demographic dividendLatin America & Caribbean Latin America & Caribbean (excluding high income)Latin America & the Caribbean (IDA & IBRD countries)LatviaLeast developed countries: UN classificationLebanonLesothoLiberiaLibyaLithuaniaLow & middle incomeLow incomeLower middle incomeLuxembourgMacao SAR, ChinaMacedonia, FYRMadagascarMalawiMalaysiaMaldivesMaliMaltaMauritaniaMauritiusMexicoMicronesia, Fed. Sts.Middle East & North AfricaMiddle East & North Africa (excluding high income)Middle East & North Africa (IDA & IBRD countries)Middle incomeMoldovaMongoliaMontenegroMoroccoMozambiqueMyanmarNamibiaNepalNetherlandsNew CaledoniaNew ZealandNicaraguaNigerNigeriaNorth AmericaNorwayOECD membersOmanOther small statesPacific island small statesPakistanPalauPanamaPapua New GuineaParaguayPeruPhilippinesPolandPortugalPost-demographic dividendPre-demographic dividendPuerto RicoQatarRomaniaRussian FederationRwandaSamoaSaudi ArabiaSenegalSerbiaSeychellesSierra LeoneSingaporeSlovak RepublicSloveniaSmall statesSolomon IslandsSomaliaSouth AfricaSouth AsiaSouth Asia (IDA & IBRD)South SudanSpainSri LankaSt. Kitts and NevisSt. LuciaSt. Vincent and the GrenadinesSub-Saharan Africa Sub-Saharan Africa (excluding high income)Sub-Saharan Africa (IDA & IBRD countries)SudanSurinameSwazilandSwedenSwitzerlandSyrian Arab RepublicTajikistanTanzaniaThailandTimor-LesteTogoTongaTrinidad and TobagoTunisiaTurkeyTurkmenistanUgandaUkraineUnited Arab EmiratesUnited KingdomUnited StatesUpper middle incomeUruguayUzbekistanVanuatuVenezuela, RBVietnamWest Bank and GazaWorldYemen, Rep.ZambiaZimbabwe Timeline:
This timeline shows a graph from 1961 to 2016 of Luxembourg. No data until 1960. Number of actual observations by date: 56.
Source name:
World Development Indicators
Source organization:
World Bank national accounts data, and OECD National Accounts data files.
Categories, topics:
Economy & Growth, Trade
Last updated:
apr 23, 2017
Indicators value changes by year
Minimum:
485.969 mln
jan 1, 1961
Maximum:
110.856 bln
jan 1, 2015
At the date of observation
Value
Absolute change
Change from previous value
jan 1, 1961
485.969 mln
+485.969 mln
0.0%
jan 1, 1962
529.105 mln
+43.136 mln
8.88%
jan 1, 1963
550.137 mln
+21.032 mln
3.97%
jan 1, 1964
574.223 mln
+24.086 mln
4.38%
jan 1, 1965
666.044 mln
+91.822 mln
15.99%
jan 1, 1966
692.154 mln
+26.11 mln
3.92%
jan 1, 1967
683.946 mln
-8.208 mln
-1.19%
jan 1, 1968
646.757 mln
-37.189 mln
-5.44%
jan 1, 1969
706.129 mln
+59.372 mln
9.18%
jan 1, 1970
809.485 mln
+103.355 mln
14.64%
jan 1, 1971
1.155 bln
+345.72 mln
42.71%
jan 1, 1972
1.341 bln
+186.062 mln
16.11%
jan 1, 1973
1.527 bln
+185.966 mln
13.86%
jan 1, 1974
2.092 bln
+564.519 mln
36.96%
jan 1, 1975
2.712 bln
+620.611 mln
29.67%
jan 1, 1976
2.88 bln
+167.519 mln
6.18%
jan 1, 1977
2.947 bln
+67.183 mln
2.33%
jan 1, 1978
3.281 bln
+333.825 mln
11.33%
jan 1, 1979
4.065 bln
+784.556 mln
23.91%
jan 1, 1980
5.013 bln
+947.701 mln
23.31%
jan 1, 1981
5.62 bln
+606.414 mln
12.1%
jan 1, 1982
4.733 bln
-886.103 mln
-15.77%
jan 1, 1983
4.365 bln
-368.894 mln
-7.79%
jan 1, 1984
4.263 bln
-102.06 mln
-2.34%
jan 1, 1985
4.615 bln
+352.761 mln
8.28%
jan 1, 1986
4.953 bln
+337.243 mln
7.31%
jan 1, 1987
6.582 bln
+1.63 bln
32.9%
jan 1, 1988
8.349 bln
+1.767 bln
26.84%
jan 1, 1989
9.442 bln
+1.093 bln
13.09%
jan 1, 1990
9.986 bln
+544.322 mln
5.76%
jan 1, 1991
12.557 bln
+2.57 bln
25.74%
jan 1, 1992
13.742 bln
+1.185 bln
9.44%
jan 1, 1993
14.531 bln
+788.8 mln
5.74%
jan 1, 1994
14.661 bln
+130.315 mln
0.9%
jan 1, 1995
16.515 bln
+1.854 bln
12.65%
jan 1, 1996
19.785 bln
+3.27 bln
19.8%
jan 1, 1997
19.702 bln
-82.533 mln
-0.42%
jan 1, 1998
19.53 bln
-172.852 mln
-0.88%
jan 1, 1999
22.01 bln
+2.48 bln
12.7%
jan 1, 2000
24.295 bln
+2.285 bln
10.38%
jan 1, 2001
26.018 bln
+1.723 bln
7.09%
jan 1, 2002
26.492 bln
+474.551 mln
1.82%
jan 1, 2003
27.452 bln
+959.848 mln
3.62%
jan 1, 2004
34.118 bln
+6.666 bln
24.28%
jan 1, 2005
44.269 bln
+10.151 bln
29.75%
jan 1, 2006
50.46 bln
+6.191 bln
13.98%
jan 1, 2007
60.893 bln
+10.434 bln
20.68%
jan 1, 2008
76.529 bln
+15.635 bln
25.68%
jan 1, 2009
87.877 bln
+11.348 bln
14.83%
jan 1, 2010
68.766 bln
-19.111 bln
-21.75%
jan 1, 2011
77.025 bln
+8.258 bln
12.01%
jan 1, 2012
90.885 bln
+13.86 bln
17.99%
jan 1, 2013
88.954 bln
-1.931 bln
-2.12%
jan 1, 2014
100.051 bln
+11.097 bln
12.47%
jan 1, 2015
110.856 bln
+10.805 bln
10.8%
jan 1, 2016
102.669 bln
-8.187 bln
-7.39%
Ranking of countries by current statistics by years


Comments: