29
/
en
AIzaSyAYiBZKx7MnpbEhh9jyipgxe19OcubqV5w
April 1, 2024
187917
Malaysia
MYS
true
2
1
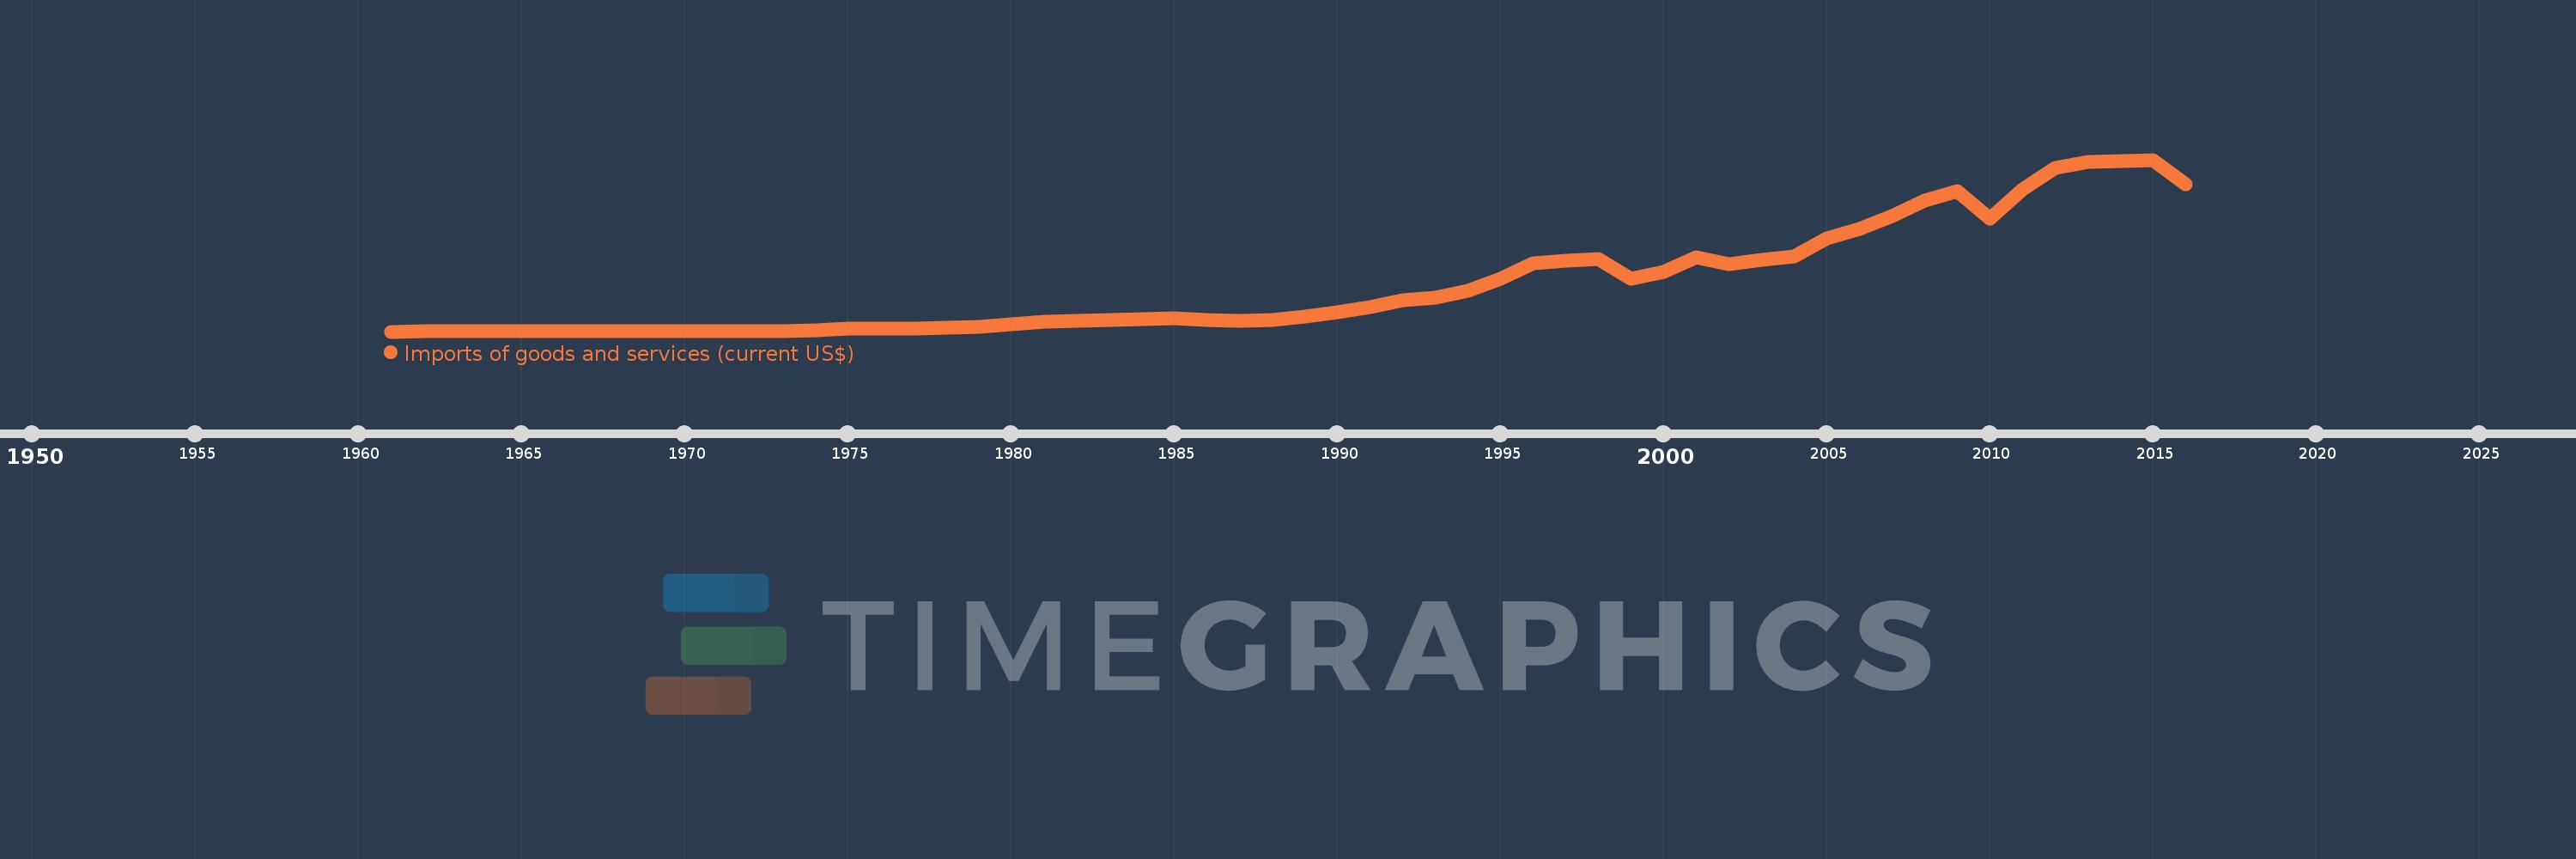
Imports of goods and services (current US$)
2016,2015,2014,2013,2012,2011,2010,2009,2008,2007,2006,2005,2004,2003,2002,2001,2000,1999,1998,1997,1996,1995,1994,1993,1992,1991,1990,1989,1988,1987,1986,1985,1984,1983,1982,1981,1980,1979,1978,1977,1976,1975,1974,1973,1972,1971,1970,1969,1968,1967,1966,1965,1964,1963,1962,1961
This statistics in other country:
AfghanistanAlbaniaAlgeriaAngolaAntigua and BarbudaArab WorldArgentinaArmeniaArubaAustraliaAustriaAzerbaijanBahamas, TheBahrainBangladeshBarbadosBelarusBelgiumBelizeBeninBermudaBhutanBoliviaBosnia and HerzegovinaBotswanaBrazilBrunei DarussalamBulgariaBurkina FasoBurundiCabo VerdeCambodiaCameroonCanadaCaribbean small statesCentral African RepublicCentral Europe and the BalticsChadChileChinaColombiaComorosCongo, Dem. Rep.Congo, Rep.Costa RicaCote d'IvoireCroatiaCubaCyprusCzech RepublicDenmarkDjiboutiDominicaDominican RepublicEarly-demographic dividendEast Asia & PacificEast Asia & Pacific (excluding high income)East Asia & Pacific (IDA & IBRD countries)EcuadorEgypt, Arab Rep.El SalvadorEquatorial GuineaEritreaEstoniaEthiopiaEuro areaEurope & Central AsiaEurope & Central Asia (excluding high income)Europe & Central Asia (IDA & IBRD countries)European UnionFaroe IslandsFijiFinlandFragile and conflict affected situationsFranceFrench PolynesiaGabonGambia, TheGeorgiaGermanyGhanaGreeceGrenadaGuatemalaGuineaGuinea-BissauGuyanaHaitiHeavily indebted poor countries (HIPC)High incomeHondurasHong Kong SAR, ChinaHungaryIBRD onlyIcelandIDA & IBRD totalIDA blendIDA onlyIDA totalIndiaIndonesiaIran, Islamic Rep.IraqIrelandIsraelItalyJamaicaJapanJordanKazakhstanKenyaKiribatiKorea, Rep.KosovoKuwaitKyrgyz RepublicLao PDRLate-demographic dividendLatin America & Caribbean Latin America & Caribbean (excluding high income)Latin America & the Caribbean (IDA & IBRD countries)LatviaLeast developed countries: UN classificationLebanonLesothoLiberiaLibyaLithuaniaLow & middle incomeLow incomeLower middle incomeLuxembourgMacao SAR, ChinaMacedonia, FYRMadagascarMalawiMalaysiaMaldivesMaliMaltaMauritaniaMauritiusMexicoMicronesia, Fed. Sts.Middle East & North AfricaMiddle East & North Africa (excluding high income)Middle East & North Africa (IDA & IBRD countries)Middle incomeMoldovaMongoliaMontenegroMoroccoMozambiqueMyanmarNamibiaNepalNetherlandsNew CaledoniaNew ZealandNicaraguaNigerNigeriaNorth AmericaNorwayOECD membersOmanOther small statesPacific island small statesPakistanPalauPanamaPapua New GuineaParaguayPeruPhilippinesPolandPortugalPost-demographic dividendPre-demographic dividendPuerto RicoQatarRomaniaRussian FederationRwandaSamoaSaudi ArabiaSenegalSerbiaSeychellesSierra LeoneSingaporeSlovak RepublicSloveniaSmall statesSolomon IslandsSomaliaSouth AfricaSouth AsiaSouth Asia (IDA & IBRD)South SudanSpainSri LankaSt. Kitts and NevisSt. LuciaSt. Vincent and the GrenadinesSub-Saharan Africa Sub-Saharan Africa (excluding high income)Sub-Saharan Africa (IDA & IBRD countries)SudanSurinameSwazilandSwedenSwitzerlandSyrian Arab RepublicTajikistanTanzaniaThailandTimor-LesteTogoTongaTrinidad and TobagoTunisiaTurkeyTurkmenistanUgandaUkraineUnited Arab EmiratesUnited KingdomUnited StatesUpper middle incomeUruguayUzbekistanVanuatuVenezuela, RBVietnamWest Bank and GazaWorldYemen, Rep.ZambiaZimbabwe Timeline:
This timeline shows a graph from 1961 to 2016 of Malaysia. No data until 1960. Number of actual observations by date: 56.
Source name:
World Development Indicators
Source organization:
World Bank national accounts data, and OECD National Accounts data files.
Categories, topics:
Economy & Growth, Trade
Last updated:
apr 23, 2017
Indicators value changes by year
Minimum:
938.378 mln
jan 1, 1961
Maximum:
218.113 bln
jan 1, 2015
At the date of observation
Value
Absolute change
Change from previous value
jan 1, 1961
938.378 mln
+938.378 mln
0.0%
jan 1, 1962
990.528 mln
+52.15 mln
5.56%
jan 1, 1963
1.063 bln
+72.158 mln
7.28%
jan 1, 1964
1.108 bln
+45.263 mln
4.26%
jan 1, 1965
1.136 bln
+28.535 mln
2.58%
jan 1, 1966
1.199 bln
+62.646 mln
5.51%
jan 1, 1967
1.233 bln
+33.455 mln
2.79%
jan 1, 1968
1.232 bln
-327.976K
-0.03%
jan 1, 1969
1.327 bln
+95.117 mln
7.72%
jan 1, 1970
1.362 bln
+35.095 mln
2.64%
jan 1, 1971
1.596 bln
+233.201 mln
17.12%
jan 1, 1972
1.662 bln
+66.494 mln
4.17%
jan 1, 1973
1.891 bln
+228.337 mln
13.74%
jan 1, 1974
2.757 bln
+866.062 mln
45.81%
jan 1, 1975
4.581 bln
+1.824 bln
66.18%
jan 1, 1976
4.207 bln
-373.299 mln
-8.15%
jan 1, 1977
4.587 bln
+379.764 mln
9.03%
jan 1, 1978
5.621 bln
+1.034 bln
22.53%
jan 1, 1979
7.143 bln
+1.522 bln
27.08%
jan 1, 1980
10.04 bln
+2.897 bln
40.56%
jan 1, 1981
13.533 bln
+3.493 bln
34.79%
jan 1, 1982
14.693 bln
+1.159 bln
8.57%
jan 1, 1983
16.036 bln
+1.343 bln
9.14%
jan 1, 1984
17.212 bln
+1.176 bln
7.33%
jan 1, 1985
17.845 bln
+633.082 mln
3.68%
jan 1, 1986
15.593 bln
-2.252 bln
-12.62%
jan 1, 1987
13.979 bln
-1.613 bln
-10.35%
jan 1, 1988
15.777 bln
+1.798 bln
12.86%
jan 1, 1989
19.826 bln
+4.049 bln
25.66%
jan 1, 1990
25.373 bln
+5.547 bln
27.98%
jan 1, 1991
31.883 bln
+6.51 bln
25.66%
jan 1, 1992
40.045 bln
+8.161 bln
25.6%
jan 1, 1993
44.155 bln
+4.11 bln
10.26%
jan 1, 1994
52.86 bln
+8.705 bln
19.72%
jan 1, 1995
67.592 bln
+14.732 bln
27.87%
jan 1, 1996
86.953 bln
+19.36 bln
28.64%
jan 1, 1997
90.962 bln
+4.009 bln
4.61%
jan 1, 1998
92.38 bln
+1.418 bln
1.56%
jan 1, 1999
67.656 bln
-24.724 bln
-26.76%
jan 1, 2000
76.188 bln
+8.532 bln
12.61%
jan 1, 2001
94.35 bln
+18.162 bln
23.84%
jan 1, 2002
86.254 bln
-8.096 bln
-8.58%
jan 1, 2003
91.821 bln
+5.567 bln
6.45%
jan 1, 2004
96.153 bln
+4.333 bln
4.72%
jan 1, 2005
118.513 bln
+22.36 bln
23.25%
jan 1, 2006
130.552 bln
+12.039 bln
10.16%
jan 1, 2007
147.06 bln
+16.507 bln
12.64%
jan 1, 2008
167.027 bln
+19.967 bln
13.58%
jan 1, 2009
178.116 bln
+11.089 bln
6.64%
jan 1, 2010
143.891 bln
-34.226 bln
-19.22%
jan 1, 2011
181.099 bln
+37.208 bln
25.86%
jan 1, 2012
207.62 bln
+26.521 bln
14.64%
jan 1, 2013
215.525 bln
+7.905 bln
3.81%
jan 1, 2014
216.893 bln
+1.368 bln
0.63%
jan 1, 2015
218.113 bln
+1.22 bln
0.56%
jan 1, 2016
187.401 bln
-30.712 bln
-14.08%
Ranking of countries by current statistics by years


Comments: