29
/
en
AIzaSyAYiBZKx7MnpbEhh9jyipgxe19OcubqV5w
April 1, 2024
31684
Europe & Central Asia (excluding high income)
ECA
false
2
1
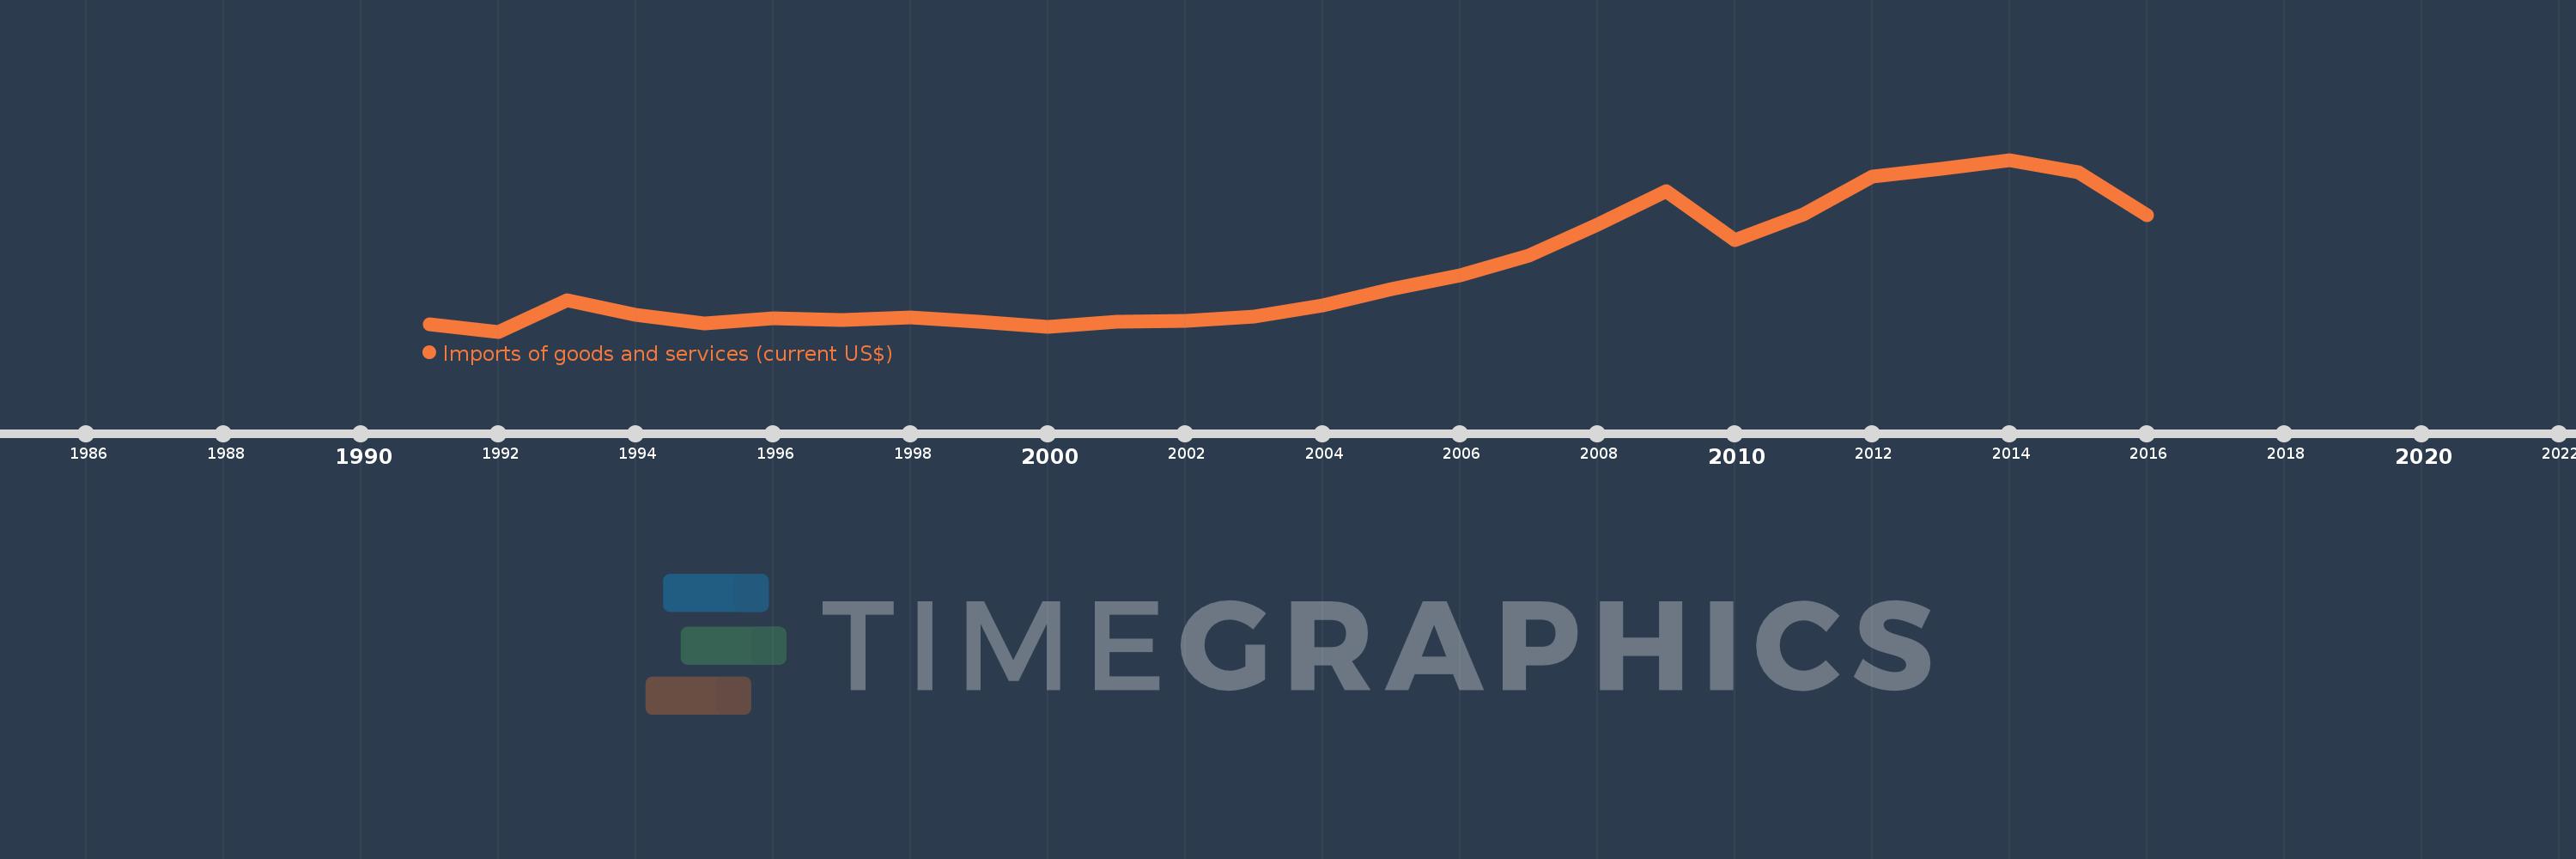
Imports of goods and services (current US$)
2016,2015,2014,2013,2012,2011,2010,2009,2008,2007,2006,2005,2004,2003,2002,2001,2000,1999,1998,1997,1996,1995,1994,1993,1992,1991
This statistics in other country:
AfghanistanAlbaniaAlgeriaAngolaAntigua and BarbudaArab WorldArgentinaArmeniaArubaAustraliaAustriaAzerbaijanBahamas, TheBahrainBangladeshBarbadosBelarusBelgiumBelizeBeninBermudaBhutanBoliviaBosnia and HerzegovinaBotswanaBrazilBrunei DarussalamBulgariaBurkina FasoBurundiCabo VerdeCambodiaCameroonCanadaCaribbean small statesCentral African RepublicCentral Europe and the BalticsChadChileChinaColombiaComorosCongo, Dem. Rep.Congo, Rep.Costa RicaCote d'IvoireCroatiaCubaCyprusCzech RepublicDenmarkDjiboutiDominicaDominican RepublicEarly-demographic dividendEast Asia & PacificEast Asia & Pacific (excluding high income)East Asia & Pacific (IDA & IBRD countries)EcuadorEgypt, Arab Rep.El SalvadorEquatorial GuineaEritreaEstoniaEthiopiaEuro areaEurope & Central AsiaEurope & Central Asia (excluding high income)Europe & Central Asia (IDA & IBRD countries)European UnionFaroe IslandsFijiFinlandFragile and conflict affected situationsFranceFrench PolynesiaGabonGambia, TheGeorgiaGermanyGhanaGreeceGrenadaGuatemalaGuineaGuinea-BissauGuyanaHaitiHeavily indebted poor countries (HIPC)High incomeHondurasHong Kong SAR, ChinaHungaryIBRD onlyIcelandIDA & IBRD totalIDA blendIDA onlyIDA totalIndiaIndonesiaIran, Islamic Rep.IraqIrelandIsraelItalyJamaicaJapanJordanKazakhstanKenyaKiribatiKorea, Rep.KosovoKuwaitKyrgyz RepublicLao PDRLate-demographic dividendLatin America & Caribbean Latin America & Caribbean (excluding high income)Latin America & the Caribbean (IDA & IBRD countries)LatviaLeast developed countries: UN classificationLebanonLesothoLiberiaLibyaLithuaniaLow & middle incomeLow incomeLower middle incomeLuxembourgMacao SAR, ChinaMacedonia, FYRMadagascarMalawiMalaysiaMaldivesMaliMaltaMauritaniaMauritiusMexicoMicronesia, Fed. Sts.Middle East & North AfricaMiddle East & North Africa (excluding high income)Middle East & North Africa (IDA & IBRD countries)Middle incomeMoldovaMongoliaMontenegroMoroccoMozambiqueMyanmarNamibiaNepalNetherlandsNew CaledoniaNew ZealandNicaraguaNigerNigeriaNorth AmericaNorwayOECD membersOmanOther small statesPacific island small statesPakistanPalauPanamaPapua New GuineaParaguayPeruPhilippinesPolandPortugalPost-demographic dividendPre-demographic dividendPuerto RicoQatarRomaniaRussian FederationRwandaSamoaSaudi ArabiaSenegalSerbiaSeychellesSierra LeoneSingaporeSlovak RepublicSloveniaSmall statesSolomon IslandsSomaliaSouth AfricaSouth AsiaSouth Asia (IDA & IBRD)South SudanSpainSri LankaSt. Kitts and NevisSt. LuciaSt. Vincent and the GrenadinesSub-Saharan Africa Sub-Saharan Africa (excluding high income)Sub-Saharan Africa (IDA & IBRD countries)SudanSurinameSwazilandSwedenSwitzerlandSyrian Arab RepublicTajikistanTanzaniaThailandTimor-LesteTogoTongaTrinidad and TobagoTunisiaTurkeyTurkmenistanUgandaUkraineUnited Arab EmiratesUnited KingdomUnited StatesUpper middle incomeUruguayUzbekistanVanuatuVenezuela, RBVietnamWest Bank and GazaWorldYemen, Rep.ZambiaZimbabwe Timeline:
This timeline shows a graph from 1991 to 2016 of Europe & Central Asia (excluding high income). No data until 1990. Number of actual observations by date: 26.
Source name:
World Development Indicators
Source organization:
World Bank national accounts data, and OECD National Accounts data files.
Categories, topics:
Economy & Growth, Trade
Last updated:
apr 23, 2017
Indicators value changes by year
Minimum:
143.46 bln
jan 1, 1992
Maximum:
1.194 trl
jan 1, 2014
At the date of observation
Value
Absolute change
Change from previous value
jan 1, 1991
188.867 bln
+188.867 bln
0.0%
jan 1, 1992
143.46 bln
-45.407 bln
-24.04%
jan 1, 1993
333.679 bln
+190.219 bln
132.59%
jan 1, 1994
243.517 bln
-90.162 bln
-27.02%
jan 1, 1995
192.259 bln
-51.258 bln
-21.05%
jan 1, 1996
223.107 bln
+30.848 bln
16.04%
jan 1, 1997
215.195 bln
-7.913 bln
-3.55%
jan 1, 1998
232.681 bln
+17.487 bln
8.13%
jan 1, 1999
201.607 bln
-31.074 bln
-13.35%
jan 1, 2000
170.151 bln
-31.457 bln
-15.6%
jan 1, 2001
201.269 bln
+31.119 bln
18.29%
jan 1, 2002
208.539 bln
+7.269 bln
3.61%
jan 1, 2003
237.933 bln
+29.395 bln
14.1%
jan 1, 2004
303.49 bln
+65.557 bln
27.55%
jan 1, 2005
404.331 bln
+100.842 bln
33.23%
jan 1, 2006
489.88 bln
+85.548 bln
21.16%
jan 1, 2007
607.348 bln
+117.468 bln
23.98%
jan 1, 2008
800.019 bln
+192.671 bln
31.72%
jan 1, 2009
1.003 trl
+203.041 bln
25.38%
jan 1, 2010
703.859 bln
-299.201 bln
-29.83%
jan 1, 2011
859.442 bln
+155.583 bln
22.1%
jan 1, 2012
1.092 trl
+232.81 bln
27.09%
jan 1, 2013
1.141 trl
+49.089 bln
4.49%
jan 1, 2014
1.194 trl
+52.62 bln
4.61%
jan 1, 2015
1.116 trl
-78.377 bln
-6.56%
jan 1, 2016
855.421 bln
-260.162 bln
-23.32%
Ranking of countries by current statistics by years


Comments: