29
/
en
AIzaSyAYiBZKx7MnpbEhh9jyipgxe19OcubqV5w
April 1, 2024
168713
Kiribati
KIR
true
2
1
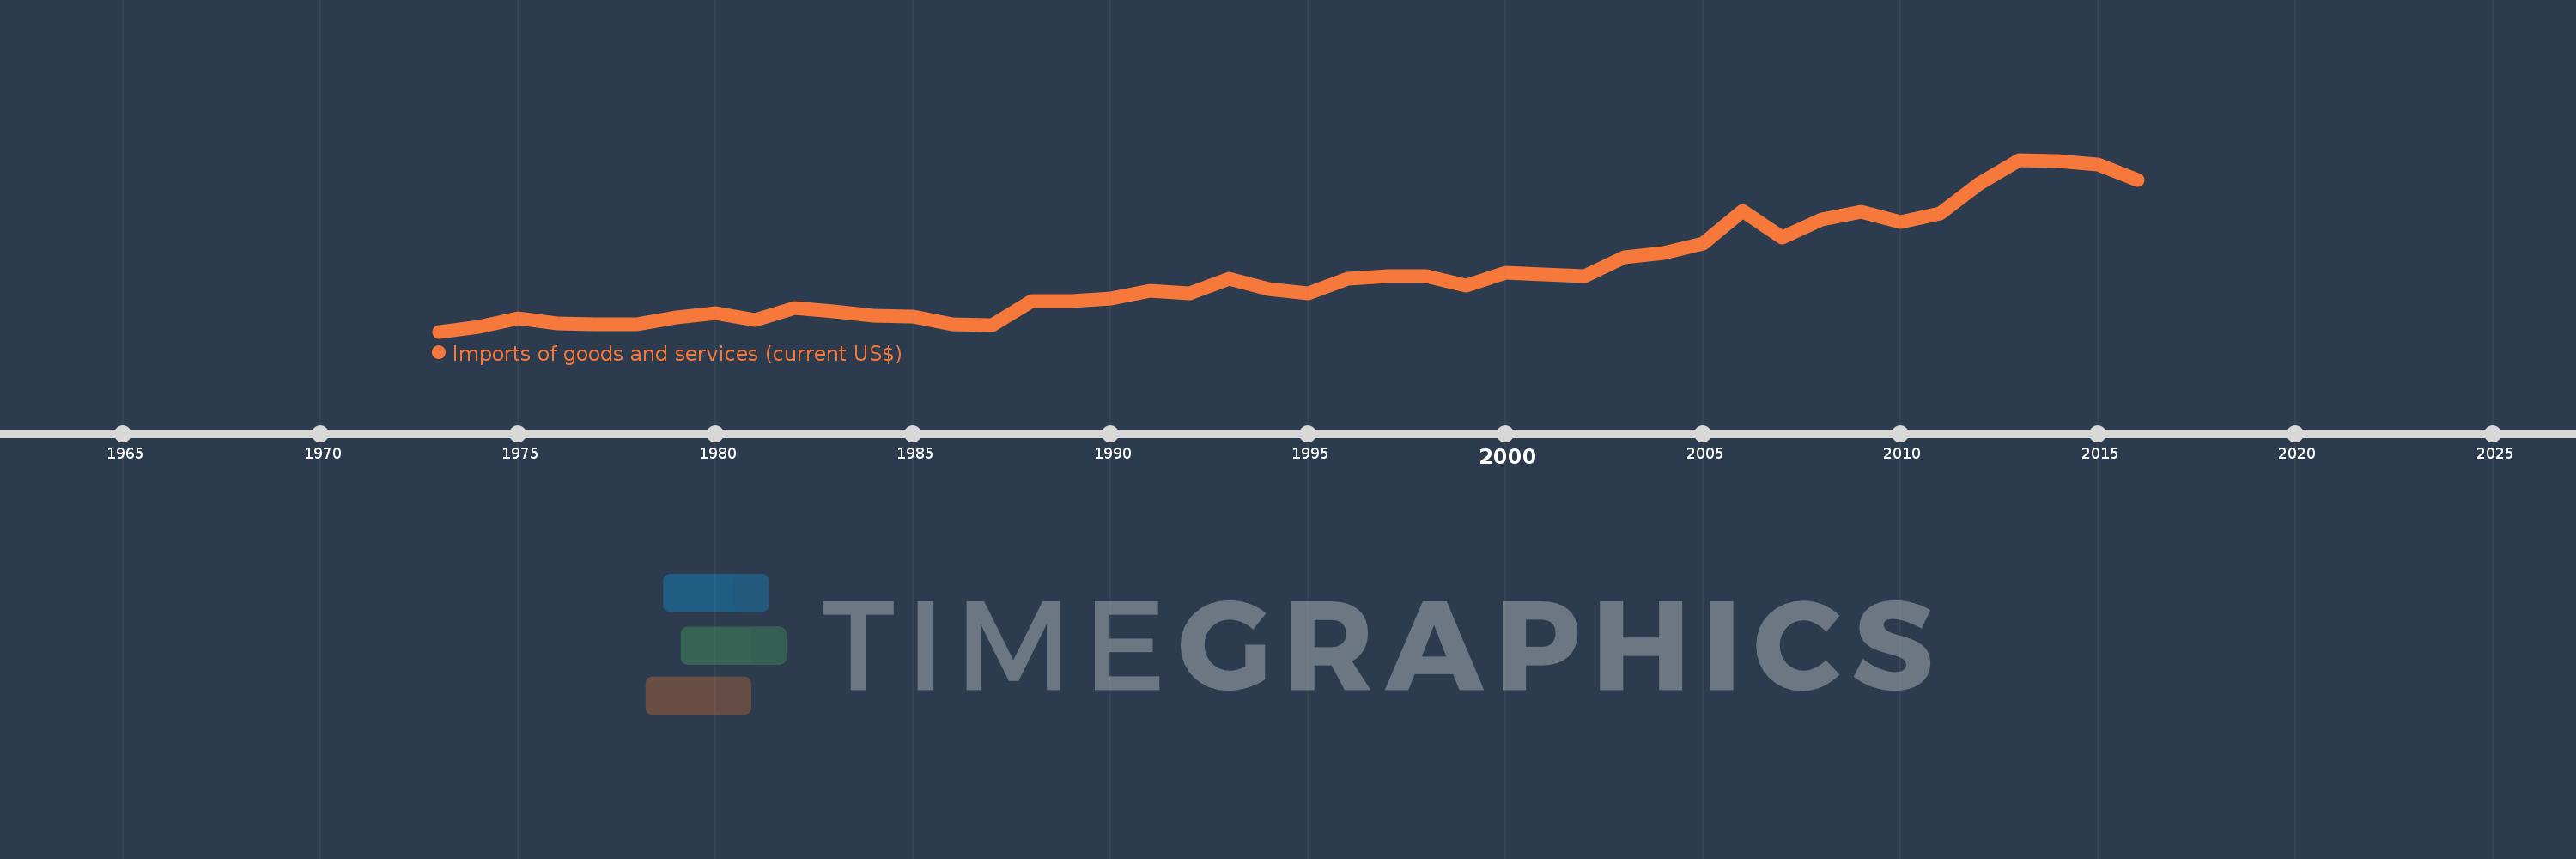
Imports of goods and services (current US$)
2016,2015,2014,2013,2012,2011,2010,2009,2008,2007,2006,2005,2004,2003,2002,2001,2000,1999,1998,1997,1996,1995,1994,1993,1992,1991,1990,1989,1988,1987,1986,1985,1984,1983,1982,1981,1980,1979,1978,1977,1976,1975,1974,1973
This statistics in other country:
AfghanistanAlbaniaAlgeriaAngolaAntigua and BarbudaArab WorldArgentinaArmeniaArubaAustraliaAustriaAzerbaijanBahamas, TheBahrainBangladeshBarbadosBelarusBelgiumBelizeBeninBermudaBhutanBoliviaBosnia and HerzegovinaBotswanaBrazilBrunei DarussalamBulgariaBurkina FasoBurundiCabo VerdeCambodiaCameroonCanadaCaribbean small statesCentral African RepublicCentral Europe and the BalticsChadChileChinaColombiaComorosCongo, Dem. Rep.Congo, Rep.Costa RicaCote d'IvoireCroatiaCubaCyprusCzech RepublicDenmarkDjiboutiDominicaDominican RepublicEarly-demographic dividendEast Asia & PacificEast Asia & Pacific (excluding high income)East Asia & Pacific (IDA & IBRD countries)EcuadorEgypt, Arab Rep.El SalvadorEquatorial GuineaEritreaEstoniaEthiopiaEuro areaEurope & Central AsiaEurope & Central Asia (excluding high income)Europe & Central Asia (IDA & IBRD countries)European UnionFaroe IslandsFijiFinlandFragile and conflict affected situationsFranceFrench PolynesiaGabonGambia, TheGeorgiaGermanyGhanaGreeceGrenadaGuatemalaGuineaGuinea-BissauGuyanaHaitiHeavily indebted poor countries (HIPC)High incomeHondurasHong Kong SAR, ChinaHungaryIBRD onlyIcelandIDA & IBRD totalIDA blendIDA onlyIDA totalIndiaIndonesiaIran, Islamic Rep.IraqIrelandIsraelItalyJamaicaJapanJordanKazakhstanKenyaKiribatiKorea, Rep.KosovoKuwaitKyrgyz RepublicLao PDRLate-demographic dividendLatin America & Caribbean Latin America & Caribbean (excluding high income)Latin America & the Caribbean (IDA & IBRD countries)LatviaLeast developed countries: UN classificationLebanonLesothoLiberiaLibyaLithuaniaLow & middle incomeLow incomeLower middle incomeLuxembourgMacao SAR, ChinaMacedonia, FYRMadagascarMalawiMalaysiaMaldivesMaliMaltaMauritaniaMauritiusMexicoMicronesia, Fed. Sts.Middle East & North AfricaMiddle East & North Africa (excluding high income)Middle East & North Africa (IDA & IBRD countries)Middle incomeMoldovaMongoliaMontenegroMoroccoMozambiqueMyanmarNamibiaNepalNetherlandsNew CaledoniaNew ZealandNicaraguaNigerNigeriaNorth AmericaNorwayOECD membersOmanOther small statesPacific island small statesPakistanPalauPanamaPapua New GuineaParaguayPeruPhilippinesPolandPortugalPost-demographic dividendPre-demographic dividendPuerto RicoQatarRomaniaRussian FederationRwandaSamoaSaudi ArabiaSenegalSerbiaSeychellesSierra LeoneSingaporeSlovak RepublicSloveniaSmall statesSolomon IslandsSomaliaSouth AfricaSouth AsiaSouth Asia (IDA & IBRD)South SudanSpainSri LankaSt. Kitts and NevisSt. LuciaSt. Vincent and the GrenadinesSub-Saharan Africa Sub-Saharan Africa (excluding high income)Sub-Saharan Africa (IDA & IBRD countries)SudanSurinameSwazilandSwedenSwitzerlandSyrian Arab RepublicTajikistanTanzaniaThailandTimor-LesteTogoTongaTrinidad and TobagoTunisiaTurkeyTurkmenistanUgandaUkraineUnited Arab EmiratesUnited KingdomUnited StatesUpper middle incomeUruguayUzbekistanVanuatuVenezuela, RBVietnamWest Bank and GazaWorldYemen, Rep.ZambiaZimbabwe Timeline:
This timeline shows a graph from 1973 to 2016 of Kiribati. No data until 1972. Number of actual observations by date: 44.
Source name:
World Development Indicators
Source organization:
World Bank national accounts data, and OECD National Accounts data files.
Categories, topics:
Economy & Growth, Trade
Last updated:
apr 23, 2017
Indicators value changes by year
Minimum:
7.461 mln
jan 1, 1973
Maximum:
174.572 mln
jan 1, 2013
At the date of observation
Value
Absolute change
Change from previous value
jan 1, 1973
7.461 mln
+7.461 mln
0.0%
jan 1, 1974
12.463 mln
+5.001 mln
67.03%
jan 1, 1975
20.383 mln
+7.92 mln
63.55%
jan 1, 1976
15.32 mln
-5.062 mln
-24.84%
jan 1, 1977
14.677 mln
-643.299K
-4.2%
jan 1, 1978
14.802 mln
+124.739K
0.85%
jan 1, 1979
20.887 mln
+6.086 mln
41.11%
jan 1, 1980
25.398 mln
+4.511 mln
21.6%
jan 1, 1981
19.107 mln
-6.291 mln
-24.77%
jan 1, 1982
30.633 mln
+11.526 mln
60.32%
jan 1, 1983
26.881 mln
-3.752 mln
-12.25%
jan 1, 1984
22.813 mln
-4.068 mln
-15.13%
jan 1, 1985
21.884 mln
-929.525K
-4.07%
jan 1, 1986
14.818 mln
-7.065 mln
-32.29%
jan 1, 1987
13.489 mln
-1.329 mln
-8.97%
jan 1, 1988
36.961 mln
+23.472 mln
174.0%
jan 1, 1989
37.074 mln
+112.311K
0.3%
jan 1, 1990
39.543 mln
+2.469 mln
6.66%
jan 1, 1991
46.922 mln
+7.38 mln
18.66%
jan 1, 1992
44.999 mln
-1.924 mln
-4.1%
jan 1, 1993
58.871 mln
+13.872 mln
30.83%
jan 1, 1994
48.503 mln
-10.368 mln
-17.61%
jan 1, 1995
44.897 mln
-3.605 mln
-7.43%
jan 1, 1996
58.672 mln
+13.775 mln
30.68%
jan 1, 1997
61.46 mln
+2.788 mln
4.75%
jan 1, 1998
61.702 mln
+242.033K
0.39%
jan 1, 1999
52.359 mln
-9.343 mln
-15.14%
jan 1, 2000
64.8 mln
+12.441 mln
23.76%
jan 1, 2001
62.686 mln
-2.114 mln
-3.26%
jan 1, 2002
61.706 mln
-980.229K
-1.56%
jan 1, 2003
79.426 mln
+17.72 mln
28.72%
jan 1, 2004
83.956 mln
+4.53 mln
5.7%
jan 1, 2005
93.163 mln
+9.206 mln
10.97%
jan 1, 2006
124.799 mln
+31.636 mln
33.96%
jan 1, 2007
98.645 mln
-26.154 mln
-20.96%
jan 1, 2008
116.268 mln
+17.623 mln
17.87%
jan 1, 2009
124.12 mln
+7.852 mln
6.75%
jan 1, 2010
114.252 mln
-9.868 mln
-7.95%
jan 1, 2011
122.46 mln
+8.207 mln
7.18%
jan 1, 2012
151.977 mln
+29.517 mln
24.1%
jan 1, 2013
174.572 mln
+22.595 mln
14.87%
jan 1, 2014
173.634 mln
-938.855K
-0.54%
jan 1, 2015
169.822 mln
-3.812 mln
-2.2%
jan 1, 2016
154.759 mln
-15.062 mln
-8.87%
Ranking of countries by current statistics by years


Comments: