29
/
en
AIzaSyAYiBZKx7MnpbEhh9jyipgxe19OcubqV5w
April 1, 2024
277798
Uruguay
URY
true
2
1
Imports of goods and services (current US$)
2016,2015,2014,2013,2012,2011,2010,2009,2008,2007,2006,2005,2004,2003,2002,2001,2000,1999,1998,1997,1996,1995,1994,1993,1992,1991,1990,1989,1988,1987,1986,1985,1984,1983,1982,1981,1980,1979,1978,1977,1976,1975,1974,1973,1972,1971,1970,1969,1968,1967
This statistics in other country:
AfghanistanAlbaniaAlgeriaAngolaAntigua and BarbudaArab WorldArgentinaArmeniaArubaAustraliaAustriaAzerbaijanBahamas, TheBahrainBangladeshBarbadosBelarusBelgiumBelizeBeninBermudaBhutanBoliviaBosnia and HerzegovinaBotswanaBrazilBrunei DarussalamBulgariaBurkina FasoBurundiCabo VerdeCambodiaCameroonCanadaCaribbean small statesCentral African RepublicCentral Europe and the BalticsChadChileChinaColombiaComorosCongo, Dem. Rep.Congo, Rep.Costa RicaCote d'IvoireCroatiaCubaCyprusCzech RepublicDenmarkDjiboutiDominicaDominican RepublicEarly-demographic dividendEast Asia & PacificEast Asia & Pacific (excluding high income)East Asia & Pacific (IDA & IBRD countries)EcuadorEgypt, Arab Rep.El SalvadorEquatorial GuineaEritreaEstoniaEthiopiaEuro areaEurope & Central AsiaEurope & Central Asia (excluding high income)Europe & Central Asia (IDA & IBRD countries)European UnionFaroe IslandsFijiFinlandFragile and conflict affected situationsFranceFrench PolynesiaGabonGambia, TheGeorgiaGermanyGhanaGreeceGrenadaGuatemalaGuineaGuinea-BissauGuyanaHaitiHeavily indebted poor countries (HIPC)High incomeHondurasHong Kong SAR, ChinaHungaryIBRD onlyIcelandIDA & IBRD totalIDA blendIDA onlyIDA totalIndiaIndonesiaIran, Islamic Rep.IraqIrelandIsraelItalyJamaicaJapanJordanKazakhstanKenyaKiribatiKorea, Rep.KosovoKuwaitKyrgyz RepublicLao PDRLate-demographic dividendLatin America & Caribbean Latin America & Caribbean (excluding high income)Latin America & the Caribbean (IDA & IBRD countries)LatviaLeast developed countries: UN classificationLebanonLesothoLiberiaLibyaLithuaniaLow & middle incomeLow incomeLower middle incomeLuxembourgMacao SAR, ChinaMacedonia, FYRMadagascarMalawiMalaysiaMaldivesMaliMaltaMauritaniaMauritiusMexicoMicronesia, Fed. Sts.Middle East & North AfricaMiddle East & North Africa (excluding high income)Middle East & North Africa (IDA & IBRD countries)Middle incomeMoldovaMongoliaMontenegroMoroccoMozambiqueMyanmarNamibiaNepalNetherlandsNew CaledoniaNew ZealandNicaraguaNigerNigeriaNorth AmericaNorwayOECD membersOmanOther small statesPacific island small statesPakistanPalauPanamaPapua New GuineaParaguayPeruPhilippinesPolandPortugalPost-demographic dividendPre-demographic dividendPuerto RicoQatarRomaniaRussian FederationRwandaSamoaSaudi ArabiaSenegalSerbiaSeychellesSierra LeoneSingaporeSlovak RepublicSloveniaSmall statesSolomon IslandsSomaliaSouth AfricaSouth AsiaSouth Asia (IDA & IBRD)South SudanSpainSri LankaSt. Kitts and NevisSt. LuciaSt. Vincent and the GrenadinesSub-Saharan Africa Sub-Saharan Africa (excluding high income)Sub-Saharan Africa (IDA & IBRD countries)SudanSurinameSwazilandSwedenSwitzerlandSyrian Arab RepublicTajikistanTanzaniaThailandTimor-LesteTogoTongaTrinidad and TobagoTunisiaTurkeyTurkmenistanUgandaUkraineUnited Arab EmiratesUnited KingdomUnited StatesUpper middle incomeUruguayUzbekistanVanuatuVenezuela, RBVietnamWest Bank and GazaWorldYemen, Rep.ZambiaZimbabwe Timeline:
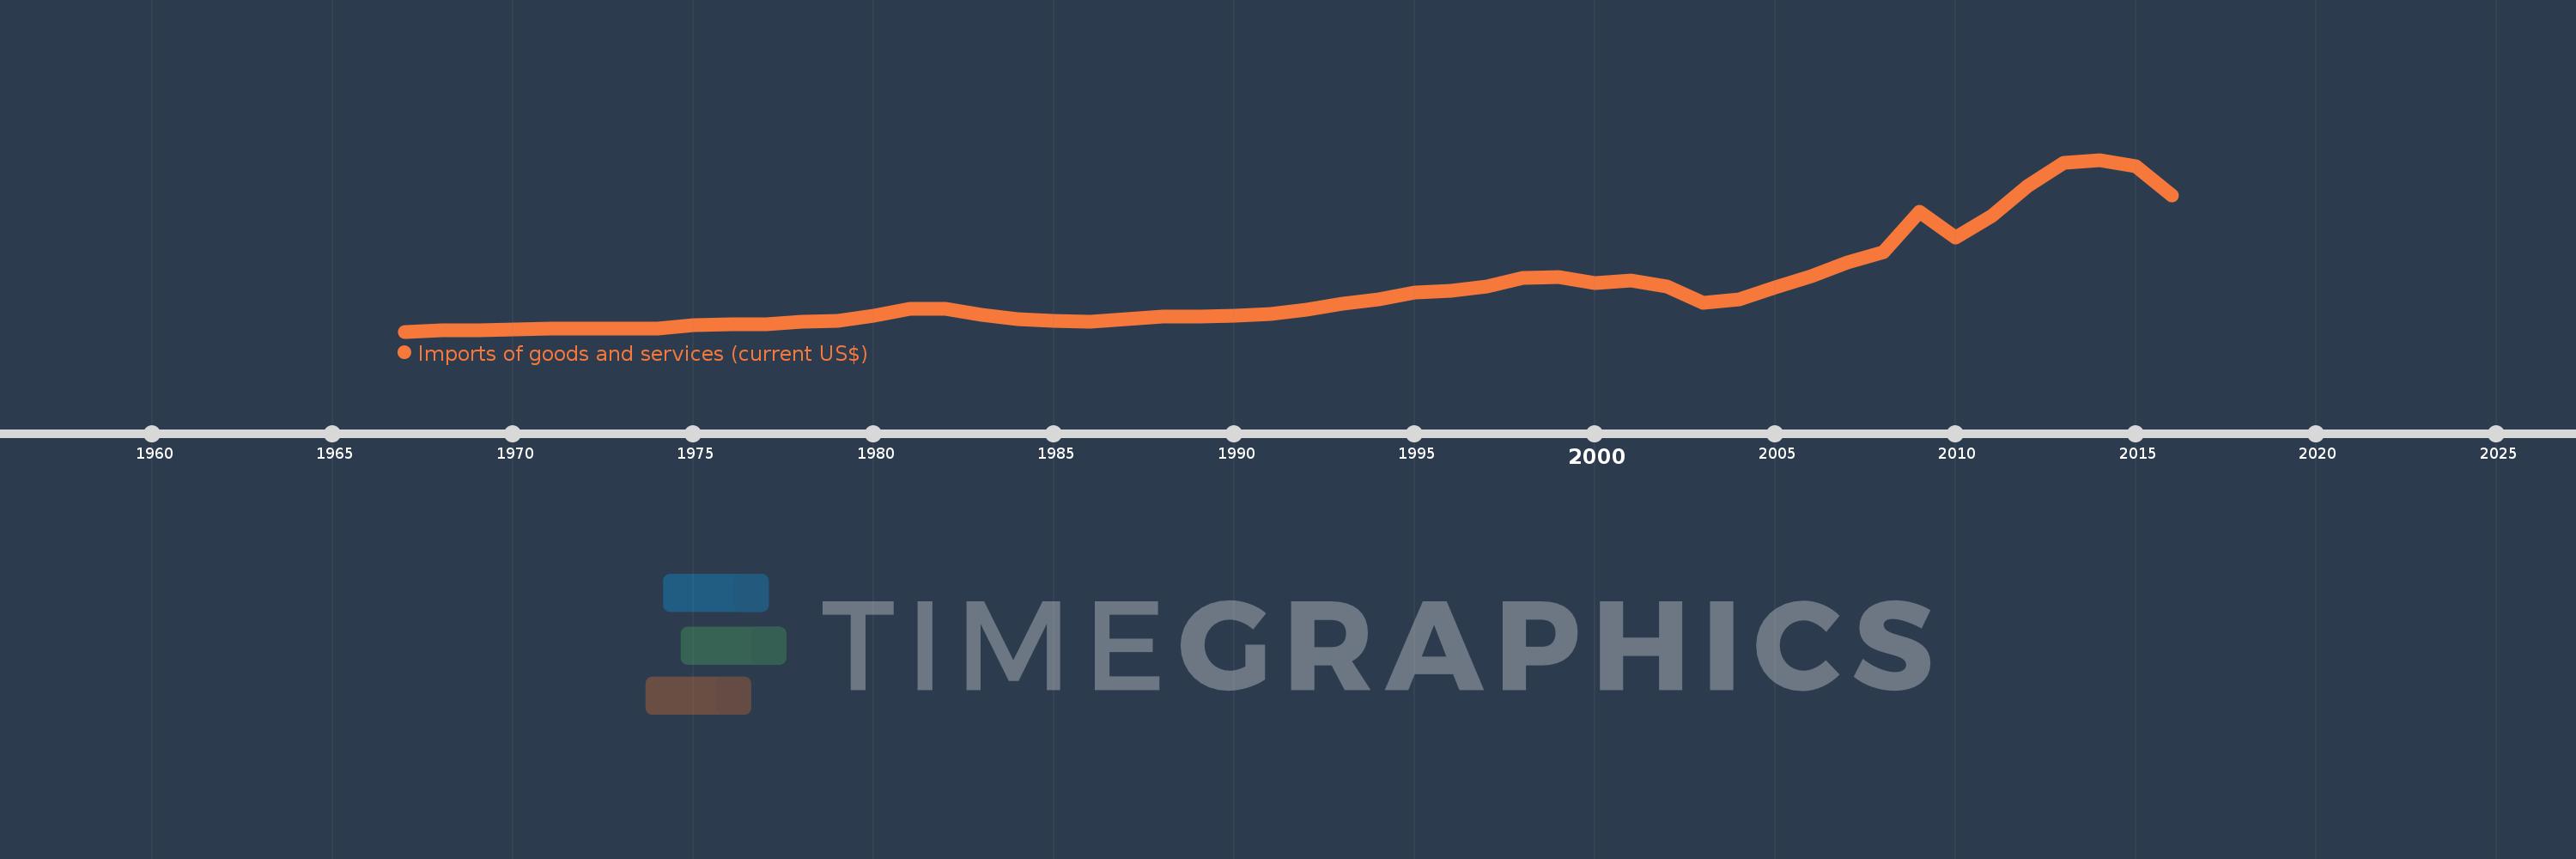
This timeline shows a graph from 1967 to 2016 of Uruguay. No data until 1966. Number of actual observations by date: 50.
Source name:
World Development Indicators
Source organization:
World Bank national accounts data, and OECD National Accounts data files.
Categories, topics:
Economy & Growth, Trade
Last updated:
apr 23, 2017
Indicators value changes by year
Minimum:
112.0 mln
jan 1, 1967
Maximum:
15.168 bln
jan 1, 2014
At the date of observation
Value
Absolute change
Change from previous value
jan 1, 1967
112.0 mln
+112.0 mln
0.0%
jan 1, 1968
221.0 mln
+109.0 mln
97.32%
jan 1, 1969
225.5 mln
+4.5 mln
2.04%
jan 1, 1970
301.5 mln
+76.0 mln
33.7%
jan 1, 1971
403.0 mln
+101.5 mln
33.67%
jan 1, 1972
398.0 mln
-5.0 mln
-1.24%
jan 1, 1973
346.2 mln
-51.8 mln
-13.02%
jan 1, 1974
358.889 mln
+12.689 mln
3.67%
jan 1, 1975
689.818 mln
+330.929 mln
92.21%
jan 1, 1976
729.182 mln
+39.364 mln
5.71%
jan 1, 1977
736.879 mln
+7.697 mln
1.06%
jan 1, 1978
941.783 mln
+204.904 mln
27.81%
jan 1, 1979
1.043 bln
+101.001 mln
10.72%
jan 1, 1980
1.528 bln
+484.729 mln
46.48%
jan 1, 1981
2.09 bln
+562.927 mln
36.85%
jan 1, 1982
2.101 bln
+10.903 mln
0.52%
jan 1, 1983
1.582 bln
-519.587 mln
-24.73%
jan 1, 1984
1.203 bln
-378.267 mln
-23.91%
jan 1, 1985
1.037 bln
-166.852 mln
-13.86%
jan 1, 1986
998.024 mln
-38.613 mln
-3.72%
jan 1, 1987
1.192 bln
+194.063 mln
19.44%
jan 1, 1988
1.415 bln
+223.048 mln
18.71%
jan 1, 1989
1.457 bln
+41.64 mln
2.94%
jan 1, 1990
1.494 bln
+36.84 mln
2.53%
jan 1, 1991
1.683 bln
+189.106 mln
12.66%
jan 1, 1992
2.002 bln
+318.803 mln
18.95%
jan 1, 1993
2.527 bln
+525.882 mln
26.27%
jan 1, 1994
2.934 bln
+406.848 mln
16.1%
jan 1, 1995
3.562 bln
+627.432 mln
21.38%
jan 1, 1996
3.686 bln
+124.333 mln
3.49%
jan 1, 1997
4.074 bln
+388.05 mln
10.53%
jan 1, 1998
4.854 bln
+779.471 mln
19.13%
jan 1, 1999
4.879 bln
+25.661 mln
0.53%
jan 1, 2000
4.386 bln
-492.827 mln
-10.1%
jan 1, 2001
4.568 bln
+181.846 mln
4.15%
jan 1, 2002
4.076 bln
-491.942 mln
-10.77%
jan 1, 2003
2.641 bln
-1.436 bln
-35.22%
jan 1, 2004
2.93 bln
+289.648 mln
10.97%
jan 1, 2005
4.019 bln
+1.089 bln
37.15%
jan 1, 2006
4.944 bln
+924.936 mln
23.01%
jan 1, 2007
6.202 bln
+1.258 bln
25.44%
jan 1, 2008
7.051 bln
+849.644 mln
13.7%
jan 1, 2009
10.63 bln
+3.578 bln
50.75%
jan 1, 2010
8.325 bln
-2.304 bln
-21.68%
jan 1, 2011
10.215 bln
+1.889 bln
22.69%
jan 1, 2012
12.866 bln
+2.651 bln
25.96%
jan 1, 2013
14.94 bln
+2.074 bln
16.12%
jan 1, 2014
15.168 bln
+228.424 mln
1.53%
jan 1, 2015
14.621 bln
-547.088 mln
-3.61%
jan 1, 2016
12.076 bln
-2.544 bln
-17.4%
Ranking of countries by current statistics by years


Comments: