29
/
en
AIzaSyAYiBZKx7MnpbEhh9jyipgxe19OcubqV5w
April 1, 2024
215399
Oman
OMN
true
2
1
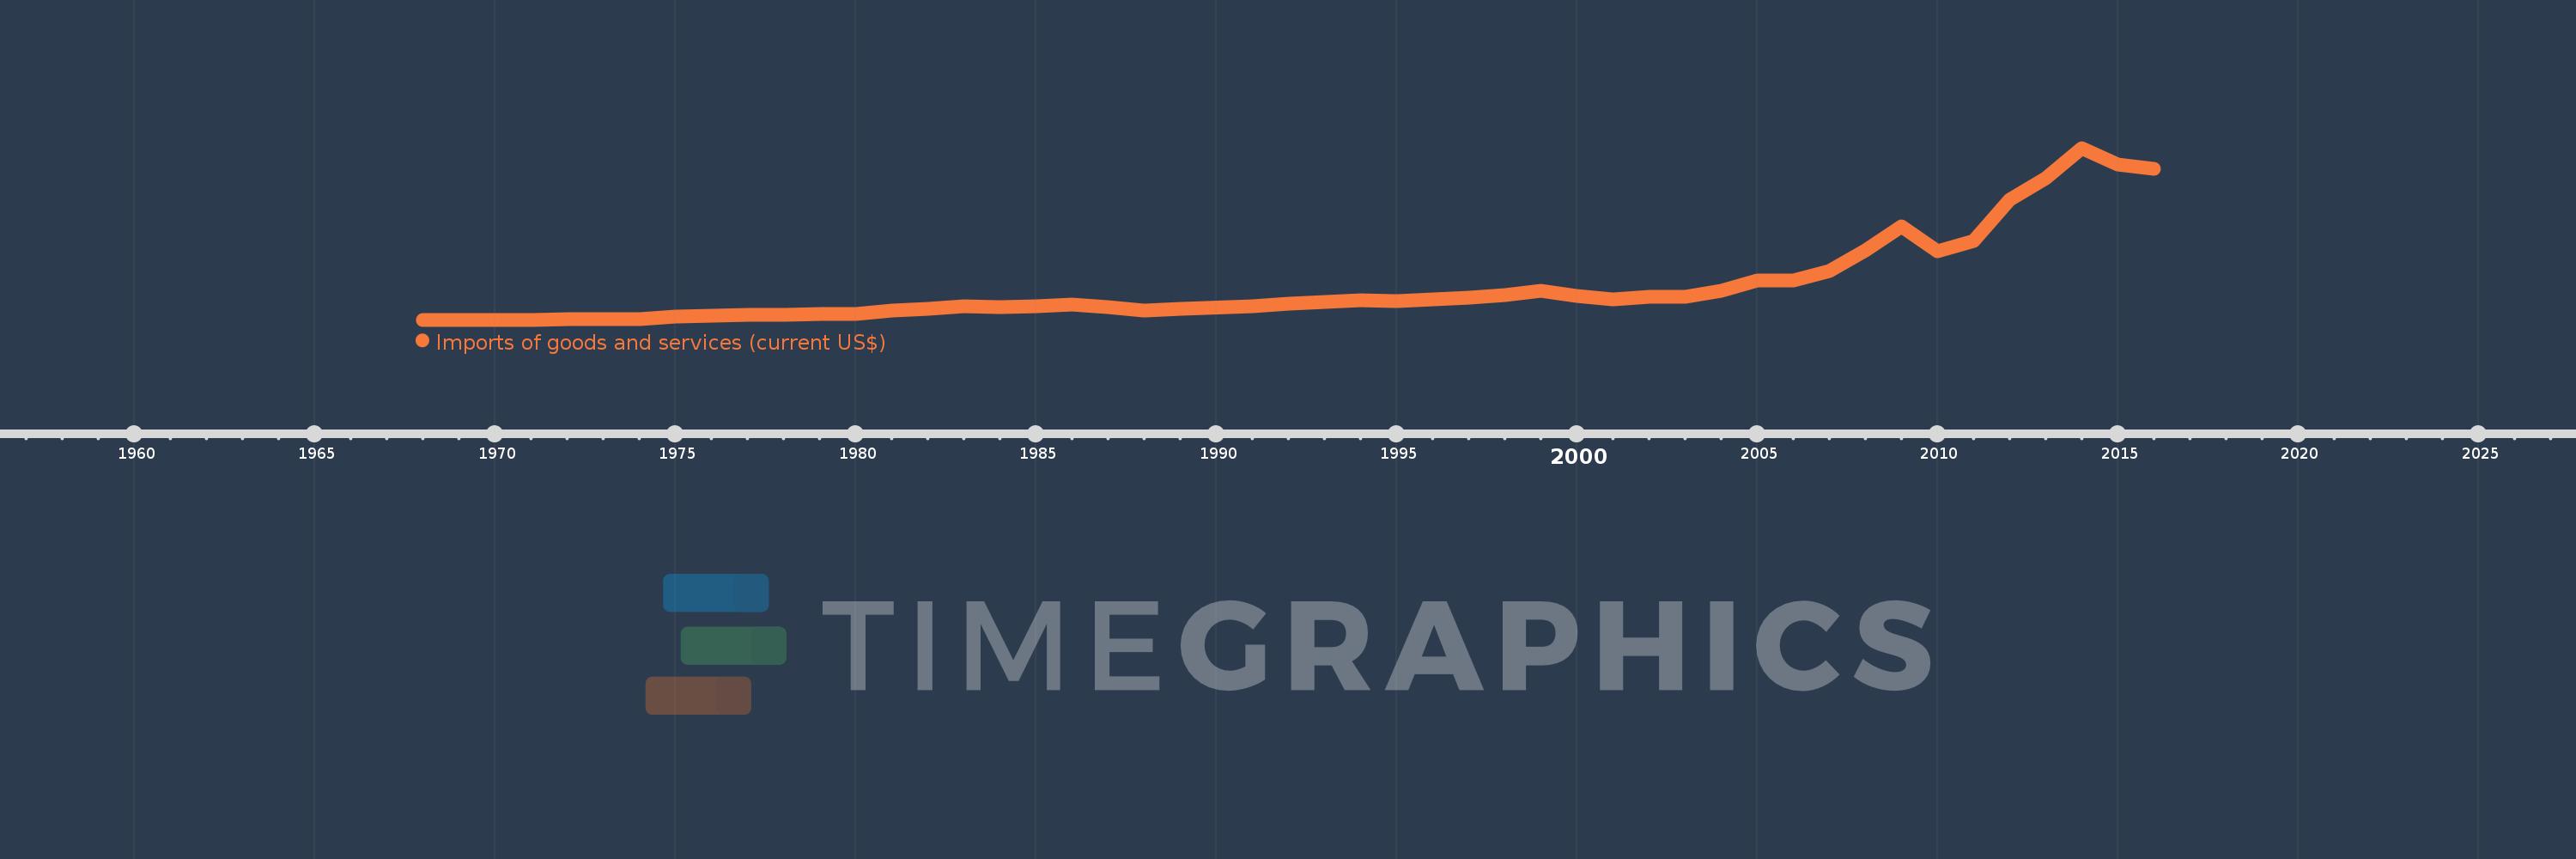
Imports of goods and services (current US$)
2016,2015,2014,2013,2012,2011,2010,2009,2008,2007,2006,2005,2004,2003,2002,2001,2000,1999,1998,1997,1996,1995,1994,1993,1992,1991,1989,1988,1987,1986,1985,1984,1983,1982,1981,1980,1979,1978,1977,1976,1975,1974,1973,1972,1971,1970,1969,1968
This statistics in other country:
AfghanistanAlbaniaAlgeriaAngolaAntigua and BarbudaArab WorldArgentinaArmeniaArubaAustraliaAustriaAzerbaijanBahamas, TheBahrainBangladeshBarbadosBelarusBelgiumBelizeBeninBermudaBhutanBoliviaBosnia and HerzegovinaBotswanaBrazilBrunei DarussalamBulgariaBurkina FasoBurundiCabo VerdeCambodiaCameroonCanadaCaribbean small statesCentral African RepublicCentral Europe and the BalticsChadChileChinaColombiaComorosCongo, Dem. Rep.Congo, Rep.Costa RicaCote d'IvoireCroatiaCubaCyprusCzech RepublicDenmarkDjiboutiDominicaDominican RepublicEarly-demographic dividendEast Asia & PacificEast Asia & Pacific (excluding high income)East Asia & Pacific (IDA & IBRD countries)EcuadorEgypt, Arab Rep.El SalvadorEquatorial GuineaEritreaEstoniaEthiopiaEuro areaEurope & Central AsiaEurope & Central Asia (excluding high income)Europe & Central Asia (IDA & IBRD countries)European UnionFaroe IslandsFijiFinlandFragile and conflict affected situationsFranceFrench PolynesiaGabonGambia, TheGeorgiaGermanyGhanaGreeceGrenadaGuatemalaGuineaGuinea-BissauGuyanaHaitiHeavily indebted poor countries (HIPC)High incomeHondurasHong Kong SAR, ChinaHungaryIBRD onlyIcelandIDA & IBRD totalIDA blendIDA onlyIDA totalIndiaIndonesiaIran, Islamic Rep.IraqIrelandIsraelItalyJamaicaJapanJordanKazakhstanKenyaKiribatiKorea, Rep.KosovoKuwaitKyrgyz RepublicLao PDRLate-demographic dividendLatin America & Caribbean Latin America & Caribbean (excluding high income)Latin America & the Caribbean (IDA & IBRD countries)LatviaLeast developed countries: UN classificationLebanonLesothoLiberiaLibyaLithuaniaLow & middle incomeLow incomeLower middle incomeLuxembourgMacao SAR, ChinaMacedonia, FYRMadagascarMalawiMalaysiaMaldivesMaliMaltaMauritaniaMauritiusMexicoMicronesia, Fed. Sts.Middle East & North AfricaMiddle East & North Africa (excluding high income)Middle East & North Africa (IDA & IBRD countries)Middle incomeMoldovaMongoliaMontenegroMoroccoMozambiqueMyanmarNamibiaNepalNetherlandsNew CaledoniaNew ZealandNicaraguaNigerNigeriaNorth AmericaNorwayOECD membersOmanOther small statesPacific island small statesPakistanPalauPanamaPapua New GuineaParaguayPeruPhilippinesPolandPortugalPost-demographic dividendPre-demographic dividendPuerto RicoQatarRomaniaRussian FederationRwandaSamoaSaudi ArabiaSenegalSerbiaSeychellesSierra LeoneSingaporeSlovak RepublicSloveniaSmall statesSolomon IslandsSomaliaSouth AfricaSouth AsiaSouth Asia (IDA & IBRD)South SudanSpainSri LankaSt. Kitts and NevisSt. LuciaSt. Vincent and the GrenadinesSub-Saharan Africa Sub-Saharan Africa (excluding high income)Sub-Saharan Africa (IDA & IBRD countries)SudanSurinameSwazilandSwedenSwitzerlandSyrian Arab RepublicTajikistanTanzaniaThailandTimor-LesteTogoTongaTrinidad and TobagoTunisiaTurkeyTurkmenistanUgandaUkraineUnited Arab EmiratesUnited KingdomUnited StatesUpper middle incomeUruguayUzbekistanVanuatuVenezuela, RBVietnamWest Bank and GazaWorldYemen, Rep.ZambiaZimbabwe Timeline:
This timeline shows a graph from 1968 to 2016 of Oman. No data until 1967. Number of actual observations by date: 48.
Source name:
World Development Indicators
Source organization:
World Bank national accounts data, and OECD National Accounts data files.
Categories, topics:
Economy & Growth, Trade
Last updated:
apr 23, 2017
Indicators value changes by year
Minimum:
24.027 mln
jan 1, 1968
Maximum:
41.831 bln
jan 1, 2014
At the date of observation
Value
Absolute change
Change from previous value
jan 1, 1968
24.027 mln
+24.027 mln
0.0%
jan 1, 1969
27.838 mln
+3.811 mln
15.86%
jan 1, 1970
28.558 mln
+719.942K
2.59%
jan 1, 1971
50.396 mln
+21.838 mln
76.47%
jan 1, 1972
96.728 mln
+46.332 mln
91.94%
jan 1, 1973
160.5 mln
+63.773 mln
65.93%
jan 1, 1974
266.61 mln
+106.109 mln
66.11%
jan 1, 1975
786.045 mln
+519.436 mln
194.83%
jan 1, 1976
1.063 bln
+276.781 mln
35.21%
jan 1, 1977
1.177 bln
+114.07 mln
10.73%
jan 1, 1978
1.207 bln
+30.399 mln
2.58%
jan 1, 1979
1.335 bln
+127.968 mln
10.6%
jan 1, 1980
1.52 bln
+184.713 mln
13.83%
jan 1, 1981
2.252 bln
+732.485 mln
48.19%
jan 1, 1982
2.765 bln
+512.449 mln
22.75%
jan 1, 1983
3.26 bln
+495.078 mln
17.91%
jan 1, 1984
3.02 bln
-240.301 mln
-7.37%
jan 1, 1985
3.315 bln
+295.309 mln
9.78%
jan 1, 1986
3.72 bln
+405.327 mln
12.23%
jan 1, 1987
2.997 bln
-722.942 mln
-19.43%
jan 1, 1988
2.27 bln
-726.901 mln
-24.25%
jan 1, 1989
2.629 bln
+358.908 mln
15.81%
jan 1, 1991
3.225 bln
+595.579 mln
22.65%
jan 1, 1992
3.94 bln
+715.215 mln
22.18%
jan 1, 1993
4.427 bln
+486.346 mln
12.34%
jan 1, 1994
4.754 bln
+327.698 mln
7.4%
jan 1, 1995
4.494 bln
-260.078 mln
-5.47%
jan 1, 1996
4.908 bln
+413.524 mln
9.2%
jan 1, 1997
5.464 bln
+556.567 mln
11.34%
jan 1, 1998
6.112 bln
+647.594 mln
11.85%
jan 1, 1999
7.004 bln
+892.068 mln
14.6%
jan 1, 2000
5.901 bln
-1.103 bln
-15.74%
jan 1, 2001
5.053 bln
-847.854 mln
-14.37%
jan 1, 2002
5.706 bln
+652.796 mln
12.92%
jan 1, 2003
5.623 bln
-83.225 mln
-1.46%
jan 1, 2004
7.095 bln
+1.472 bln
26.18%
jan 1, 2005
9.625 bln
+2.531 bln
35.67%
jan 1, 2006
9.654 bln
+28.609 mln
0.3%
jan 1, 2007
11.784 bln
+2.13 bln
22.06%
jan 1, 2008
16.83 bln
+5.046 bln
42.82%
jan 1, 2009
22.645 bln
+5.815 bln
34.55%
jan 1, 2010
16.765 bln
-5.88 bln
-25.97%
jan 1, 2011
19.168 bln
+2.403 bln
14.33%
jan 1, 2012
29.235 bln
+10.068 bln
52.52%
jan 1, 2013
34.395 bln
+5.16 bln
17.65%
jan 1, 2014
41.831 bln
+7.436 bln
21.62%
jan 1, 2015
37.857 bln
-3.974 bln
-9.5%
jan 1, 2016
36.666 bln
-1.191 bln
-3.15%
Ranking of countries by current statistics by years


Comments: