29
/
en
AIzaSyAYiBZKx7MnpbEhh9jyipgxe19OcubqV5w
April 1, 2024
71272
Armenia
ARM
true
2
1
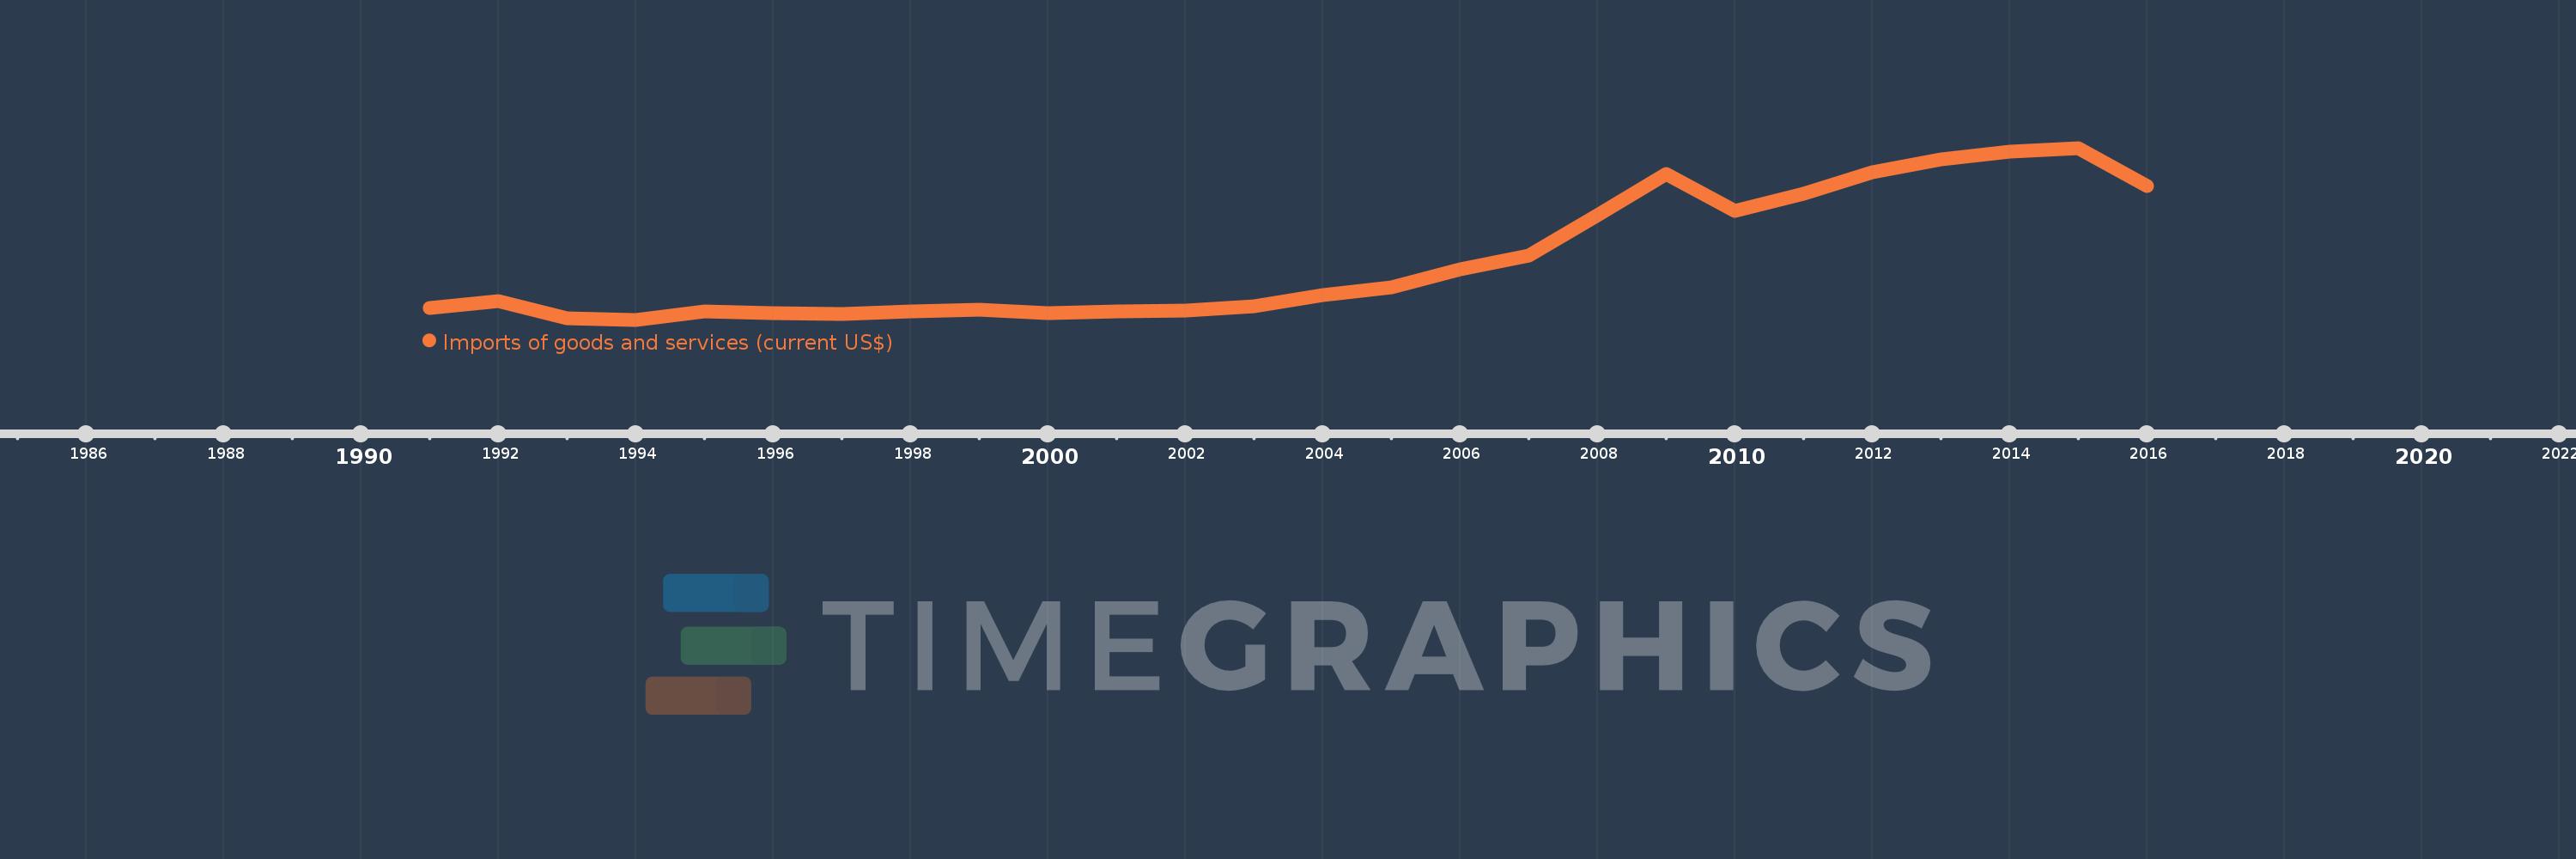
Imports of goods and services (current US$)
2016,2015,2014,2013,2012,2011,2010,2009,2008,2007,2006,2005,2004,2003,2002,2001,2000,1999,1998,1997,1996,1995,1994,1993,1992,1991
This statistics in other country:
AfghanistanAlbaniaAlgeriaAngolaAntigua and BarbudaArab WorldArgentinaArmeniaArubaAustraliaAustriaAzerbaijanBahamas, TheBahrainBangladeshBarbadosBelarusBelgiumBelizeBeninBermudaBhutanBoliviaBosnia and HerzegovinaBotswanaBrazilBrunei DarussalamBulgariaBurkina FasoBurundiCabo VerdeCambodiaCameroonCanadaCaribbean small statesCentral African RepublicCentral Europe and the BalticsChadChileChinaColombiaComorosCongo, Dem. Rep.Congo, Rep.Costa RicaCote d'IvoireCroatiaCubaCyprusCzech RepublicDenmarkDjiboutiDominicaDominican RepublicEarly-demographic dividendEast Asia & PacificEast Asia & Pacific (excluding high income)East Asia & Pacific (IDA & IBRD countries)EcuadorEgypt, Arab Rep.El SalvadorEquatorial GuineaEritreaEstoniaEthiopiaEuro areaEurope & Central AsiaEurope & Central Asia (excluding high income)Europe & Central Asia (IDA & IBRD countries)European UnionFaroe IslandsFijiFinlandFragile and conflict affected situationsFranceFrench PolynesiaGabonGambia, TheGeorgiaGermanyGhanaGreeceGrenadaGuatemalaGuineaGuinea-BissauGuyanaHaitiHeavily indebted poor countries (HIPC)High incomeHondurasHong Kong SAR, ChinaHungaryIBRD onlyIcelandIDA & IBRD totalIDA blendIDA onlyIDA totalIndiaIndonesiaIran, Islamic Rep.IraqIrelandIsraelItalyJamaicaJapanJordanKazakhstanKenyaKiribatiKorea, Rep.KosovoKuwaitKyrgyz RepublicLao PDRLate-demographic dividendLatin America & Caribbean Latin America & Caribbean (excluding high income)Latin America & the Caribbean (IDA & IBRD countries)LatviaLeast developed countries: UN classificationLebanonLesothoLiberiaLibyaLithuaniaLow & middle incomeLow incomeLower middle incomeLuxembourgMacao SAR, ChinaMacedonia, FYRMadagascarMalawiMalaysiaMaldivesMaliMaltaMauritaniaMauritiusMexicoMicronesia, Fed. Sts.Middle East & North AfricaMiddle East & North Africa (excluding high income)Middle East & North Africa (IDA & IBRD countries)Middle incomeMoldovaMongoliaMontenegroMoroccoMozambiqueMyanmarNamibiaNepalNetherlandsNew CaledoniaNew ZealandNicaraguaNigerNigeriaNorth AmericaNorwayOECD membersOmanOther small statesPacific island small statesPakistanPalauPanamaPapua New GuineaParaguayPeruPhilippinesPolandPortugalPost-demographic dividendPre-demographic dividendPuerto RicoQatarRomaniaRussian FederationRwandaSamoaSaudi ArabiaSenegalSerbiaSeychellesSierra LeoneSingaporeSlovak RepublicSloveniaSmall statesSolomon IslandsSomaliaSouth AfricaSouth AsiaSouth Asia (IDA & IBRD)South SudanSpainSri LankaSt. Kitts and NevisSt. LuciaSt. Vincent and the GrenadinesSub-Saharan Africa Sub-Saharan Africa (excluding high income)Sub-Saharan Africa (IDA & IBRD countries)SudanSurinameSwazilandSwedenSwitzerlandSyrian Arab RepublicTajikistanTanzaniaThailandTimor-LesteTogoTongaTrinidad and TobagoTunisiaTurkeyTurkmenistanUgandaUkraineUnited Arab EmiratesUnited KingdomUnited StatesUpper middle incomeUruguayUzbekistanVanuatuVenezuela, RBVietnamWest Bank and GazaWorldYemen, Rep.ZambiaZimbabwe Timeline:
This timeline shows a graph from 1991 to 2016 of Armenia. No data until 1990. Number of actual observations by date: 26.
Source name:
World Development Indicators
Source organization:
World Bank national accounts data, and OECD National Accounts data files.
Categories, topics:
Economy & Growth, Trade
Last updated:
apr 23, 2017
Indicators value changes by year
Minimum:
729.848 mln
jan 1, 1994
Maximum:
5.462 bln
jan 1, 2015
At the date of observation
Value
Absolute change
Change from previous value
jan 1, 1991
1.046 bln
+1.046 bln
0.0%
jan 1, 1992
1.244 bln
+197.953 mln
18.93%
jan 1, 1993
779.53 mln
-464.078 mln
-37.32%
jan 1, 1994
729.848 mln
-49.682 mln
-6.37%
jan 1, 1995
961.391 mln
+231.544 mln
31.72%
jan 1, 1996
913.102 mln
-48.29 mln
-5.02%
jan 1, 1997
894.136 mln
-18.966 mln
-2.08%
jan 1, 1998
955.406 mln
+61.27 mln
6.85%
jan 1, 1999
1.001 bln
+45.229 mln
4.73%
jan 1, 2000
919.09 mln
-81.544 mln
-8.15%
jan 1, 2001
966.167 mln
+47.077 mln
5.12%
jan 1, 2002
977.648 mln
+11.48 mln
1.19%
jan 1, 2003
1.107 bln
+129.412 mln
13.24%
jan 1, 2004
1.405 bln
+297.453 mln
26.87%
jan 1, 2005
1.62 bln
+215.779 mln
15.36%
jan 1, 2006
2.118 bln
+498.167 mln
30.75%
jan 1, 2007
2.506 bln
+387.452 mln
18.29%
jan 1, 2008
3.604 bln
+1.098 bln
43.83%
jan 1, 2009
4.741 bln
+1.137 bln
31.54%
jan 1, 2010
3.719 bln
-1.022 bln
-21.56%
jan 1, 2011
4.197 bln
+477.508 mln
12.84%
jan 1, 2012
4.803 bln
+606.195 mln
14.45%
jan 1, 2013
5.14 bln
+337.057 mln
7.02%
jan 1, 2014
5.36 bln
+220.467 mln
4.29%
jan 1, 2015
5.462 bln
+101.654 mln
1.9%
jan 1, 2016
4.418 bln
-1.044 bln
-19.11%
Ranking of countries by current statistics by years


Comments: