29
/
en
AIzaSyAYiBZKx7MnpbEhh9jyipgxe19OcubqV5w
April 1, 2024
174238
Lao PDR
LAO
true
2
1
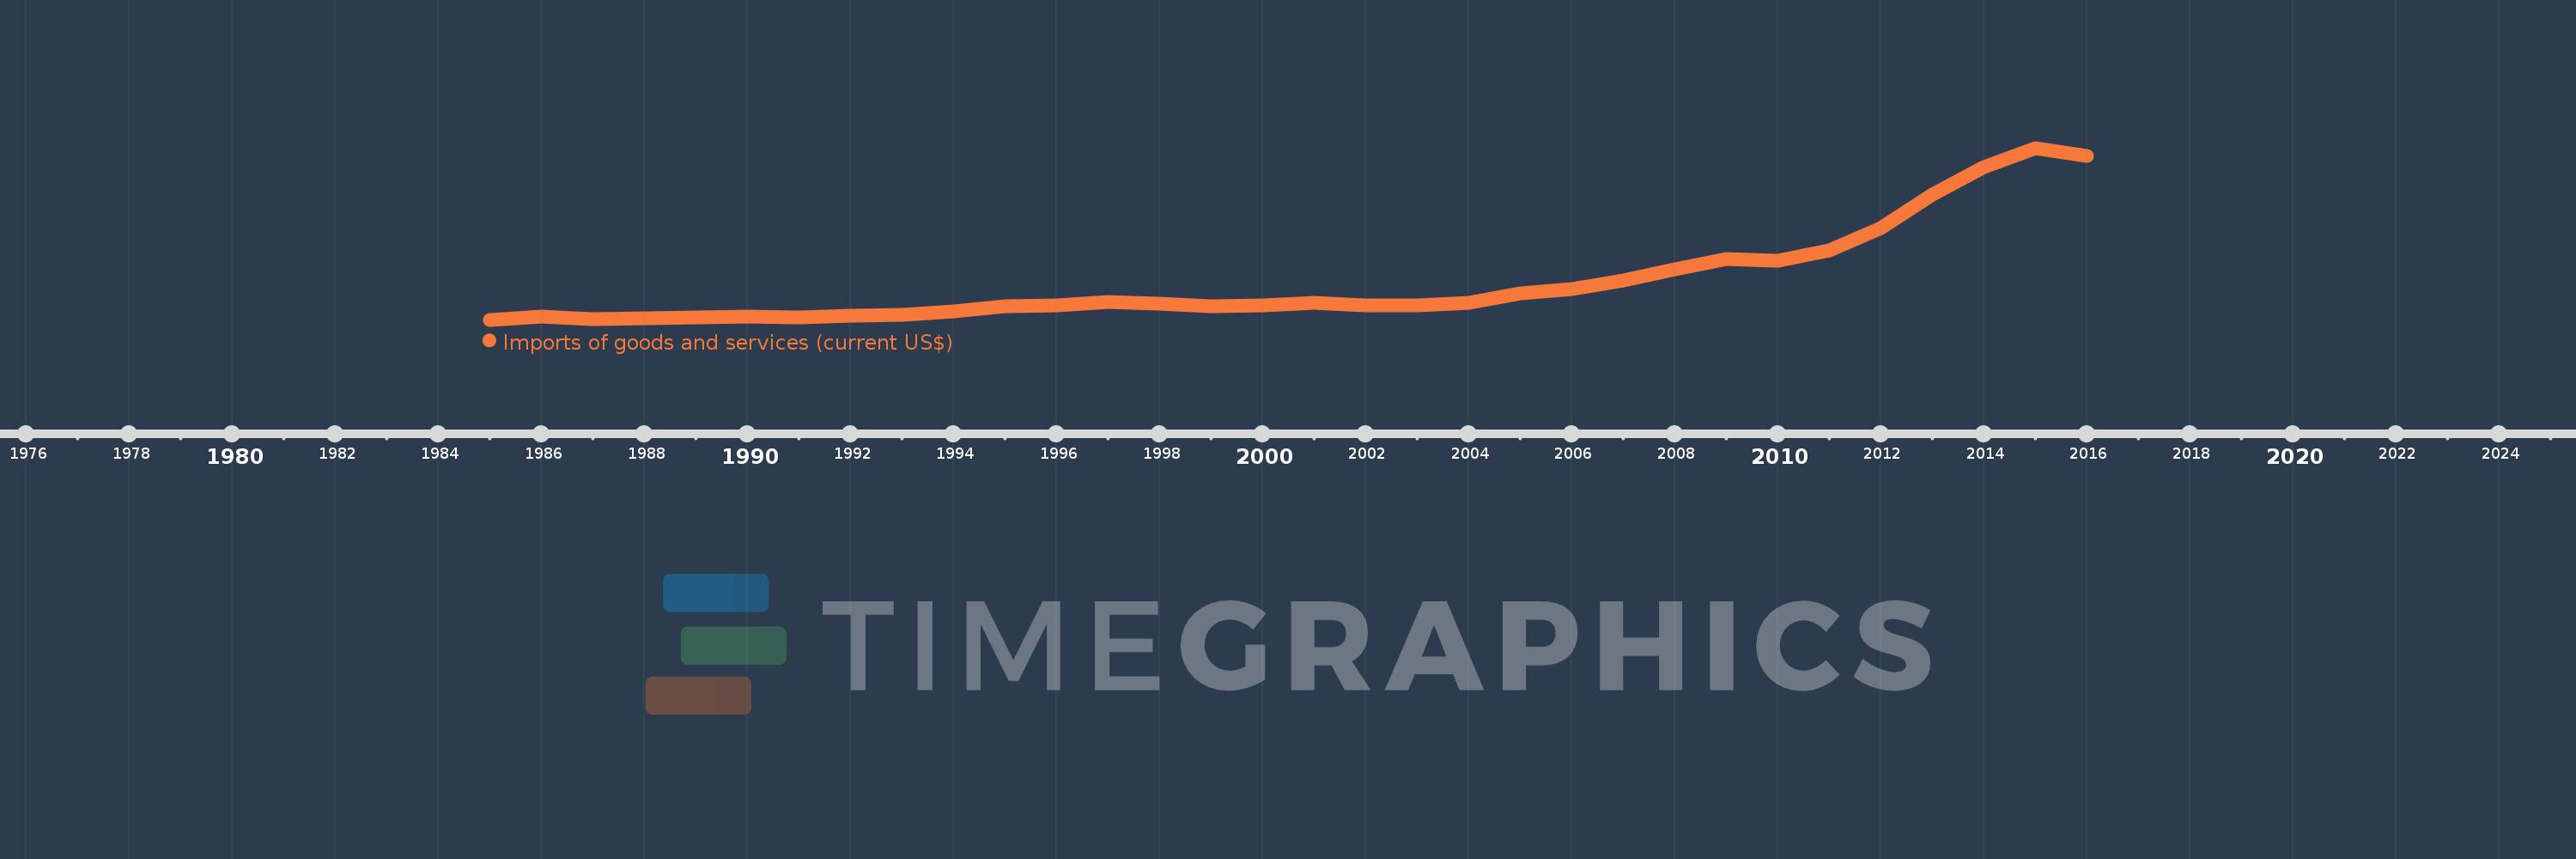
Imports of goods and services (current US$)
2016,2015,2014,2013,2012,2011,2010,2009,2008,2007,2006,2005,2004,2003,2002,2001,2000,1999,1998,1997,1996,1995,1994,1993,1992,1991,1990,1989,1988,1987,1986,1985
This statistics in other country:
AfghanistanAlbaniaAlgeriaAngolaAntigua and BarbudaArab WorldArgentinaArmeniaArubaAustraliaAustriaAzerbaijanBahamas, TheBahrainBangladeshBarbadosBelarusBelgiumBelizeBeninBermudaBhutanBoliviaBosnia and HerzegovinaBotswanaBrazilBrunei DarussalamBulgariaBurkina FasoBurundiCabo VerdeCambodiaCameroonCanadaCaribbean small statesCentral African RepublicCentral Europe and the BalticsChadChileChinaColombiaComorosCongo, Dem. Rep.Congo, Rep.Costa RicaCote d'IvoireCroatiaCubaCyprusCzech RepublicDenmarkDjiboutiDominicaDominican RepublicEarly-demographic dividendEast Asia & PacificEast Asia & Pacific (excluding high income)East Asia & Pacific (IDA & IBRD countries)EcuadorEgypt, Arab Rep.El SalvadorEquatorial GuineaEritreaEstoniaEthiopiaEuro areaEurope & Central AsiaEurope & Central Asia (excluding high income)Europe & Central Asia (IDA & IBRD countries)European UnionFaroe IslandsFijiFinlandFragile and conflict affected situationsFranceFrench PolynesiaGabonGambia, TheGeorgiaGermanyGhanaGreeceGrenadaGuatemalaGuineaGuinea-BissauGuyanaHaitiHeavily indebted poor countries (HIPC)High incomeHondurasHong Kong SAR, ChinaHungaryIBRD onlyIcelandIDA & IBRD totalIDA blendIDA onlyIDA totalIndiaIndonesiaIran, Islamic Rep.IraqIrelandIsraelItalyJamaicaJapanJordanKazakhstanKenyaKiribatiKorea, Rep.KosovoKuwaitKyrgyz RepublicLao PDRLate-demographic dividendLatin America & Caribbean Latin America & Caribbean (excluding high income)Latin America & the Caribbean (IDA & IBRD countries)LatviaLeast developed countries: UN classificationLebanonLesothoLiberiaLibyaLithuaniaLow & middle incomeLow incomeLower middle incomeLuxembourgMacao SAR, ChinaMacedonia, FYRMadagascarMalawiMalaysiaMaldivesMaliMaltaMauritaniaMauritiusMexicoMicronesia, Fed. Sts.Middle East & North AfricaMiddle East & North Africa (excluding high income)Middle East & North Africa (IDA & IBRD countries)Middle incomeMoldovaMongoliaMontenegroMoroccoMozambiqueMyanmarNamibiaNepalNetherlandsNew CaledoniaNew ZealandNicaraguaNigerNigeriaNorth AmericaNorwayOECD membersOmanOther small statesPacific island small statesPakistanPalauPanamaPapua New GuineaParaguayPeruPhilippinesPolandPortugalPost-demographic dividendPre-demographic dividendPuerto RicoQatarRomaniaRussian FederationRwandaSamoaSaudi ArabiaSenegalSerbiaSeychellesSierra LeoneSingaporeSlovak RepublicSloveniaSmall statesSolomon IslandsSomaliaSouth AfricaSouth AsiaSouth Asia (IDA & IBRD)South SudanSpainSri LankaSt. Kitts and NevisSt. LuciaSt. Vincent and the GrenadinesSub-Saharan Africa Sub-Saharan Africa (excluding high income)Sub-Saharan Africa (IDA & IBRD countries)SudanSurinameSwazilandSwedenSwitzerlandSyrian Arab RepublicTajikistanTanzaniaThailandTimor-LesteTogoTongaTrinidad and TobagoTunisiaTurkeyTurkmenistanUgandaUkraineUnited Arab EmiratesUnited KingdomUnited StatesUpper middle incomeUruguayUzbekistanVanuatuVenezuela, RBVietnamWest Bank and GazaWorldYemen, Rep.ZambiaZimbabwe Timeline:
This timeline shows a graph from 1985 to 2016 of Lao PDR. No data until 1984. Number of actual observations by date: 32.
Source name:
World Development Indicators
Source organization:
World Bank national accounts data, and OECD National Accounts data files.
Categories, topics:
Economy & Growth, Trade
Last updated:
apr 23, 2017
Indicators value changes by year
Minimum:
111.429 mln
jan 1, 1985
Maximum:
6.603 bln
jan 1, 2015
At the date of observation
Value
Absolute change
Change from previous value
jan 1, 1985
111.429 mln
+111.429 mln
0.0%
jan 1, 1986
231.111 mln
+119.683 mln
107.41%
jan 1, 1987
136.842 mln
-94.269 mln
-40.79%
jan 1, 1988
152.469 mln
+15.627 mln
11.42%
jan 1, 1989
191.066 mln
+38.596 mln
25.31%
jan 1, 1990
228.468 mln
+37.402 mln
19.58%
jan 1, 1991
212.222 mln
-16.246 mln
-7.11%
jan 1, 1992
259.372 mln
+47.15 mln
22.22%
jan 1, 1993
305.692 mln
+46.32 mln
17.86%
jan 1, 1994
413.822 mln
+108.13 mln
35.37%
jan 1, 1995
614.7 mln
+200.878 mln
48.54%
jan 1, 1996
658.4 mln
+43.7 mln
7.11%
jan 1, 1997
769.3 mln
+110.9 mln
16.84%
jan 1, 1998
720.9 mln
-48.4 mln
-6.29%
jan 1, 1999
612.1 mln
-108.8 mln
-15.09%
jan 1, 2000
642.605 mln
+30.506 mln
4.98%
jan 1, 2001
765.44 mln
+122.835 mln
19.12%
jan 1, 2002
668.71 mln
-96.73 mln
-12.64%
jan 1, 2003
648.665 mln
-20.044 mln
-3.0%
jan 1, 2004
749.579 mln
+100.913 mln
15.56%
jan 1, 2005
1.111 bln
+361.551 mln
48.23%
jan 1, 2006
1.272 bln
+160.885 mln
14.48%
jan 1, 2007
1.586 bln
+313.642 mln
24.66%
jan 1, 2008
2.025 bln
+439.59 mln
27.72%
jan 1, 2009
2.407 bln
+381.626 mln
18.84%
jan 1, 2010
2.338 bln
-68.397 mln
-2.84%
jan 1, 2011
2.738 bln
+399.099 mln
17.07%
jan 1, 2012
3.566 bln
+828.154 mln
30.25%
jan 1, 2013
4.83 bln
+1.265 bln
35.46%
jan 1, 2014
5.89 bln
+1.059 bln
21.93%
jan 1, 2015
6.603 bln
+712.881 mln
12.1%
jan 1, 2016
6.303 bln
-299.232 mln
-4.53%
Ranking of countries by current statistics by years


Comments: