29
/
en
AIzaSyAYiBZKx7MnpbEhh9jyipgxe19OcubqV5w
April 1, 2024
54128
Pacific island small states
PSS
false
2
1
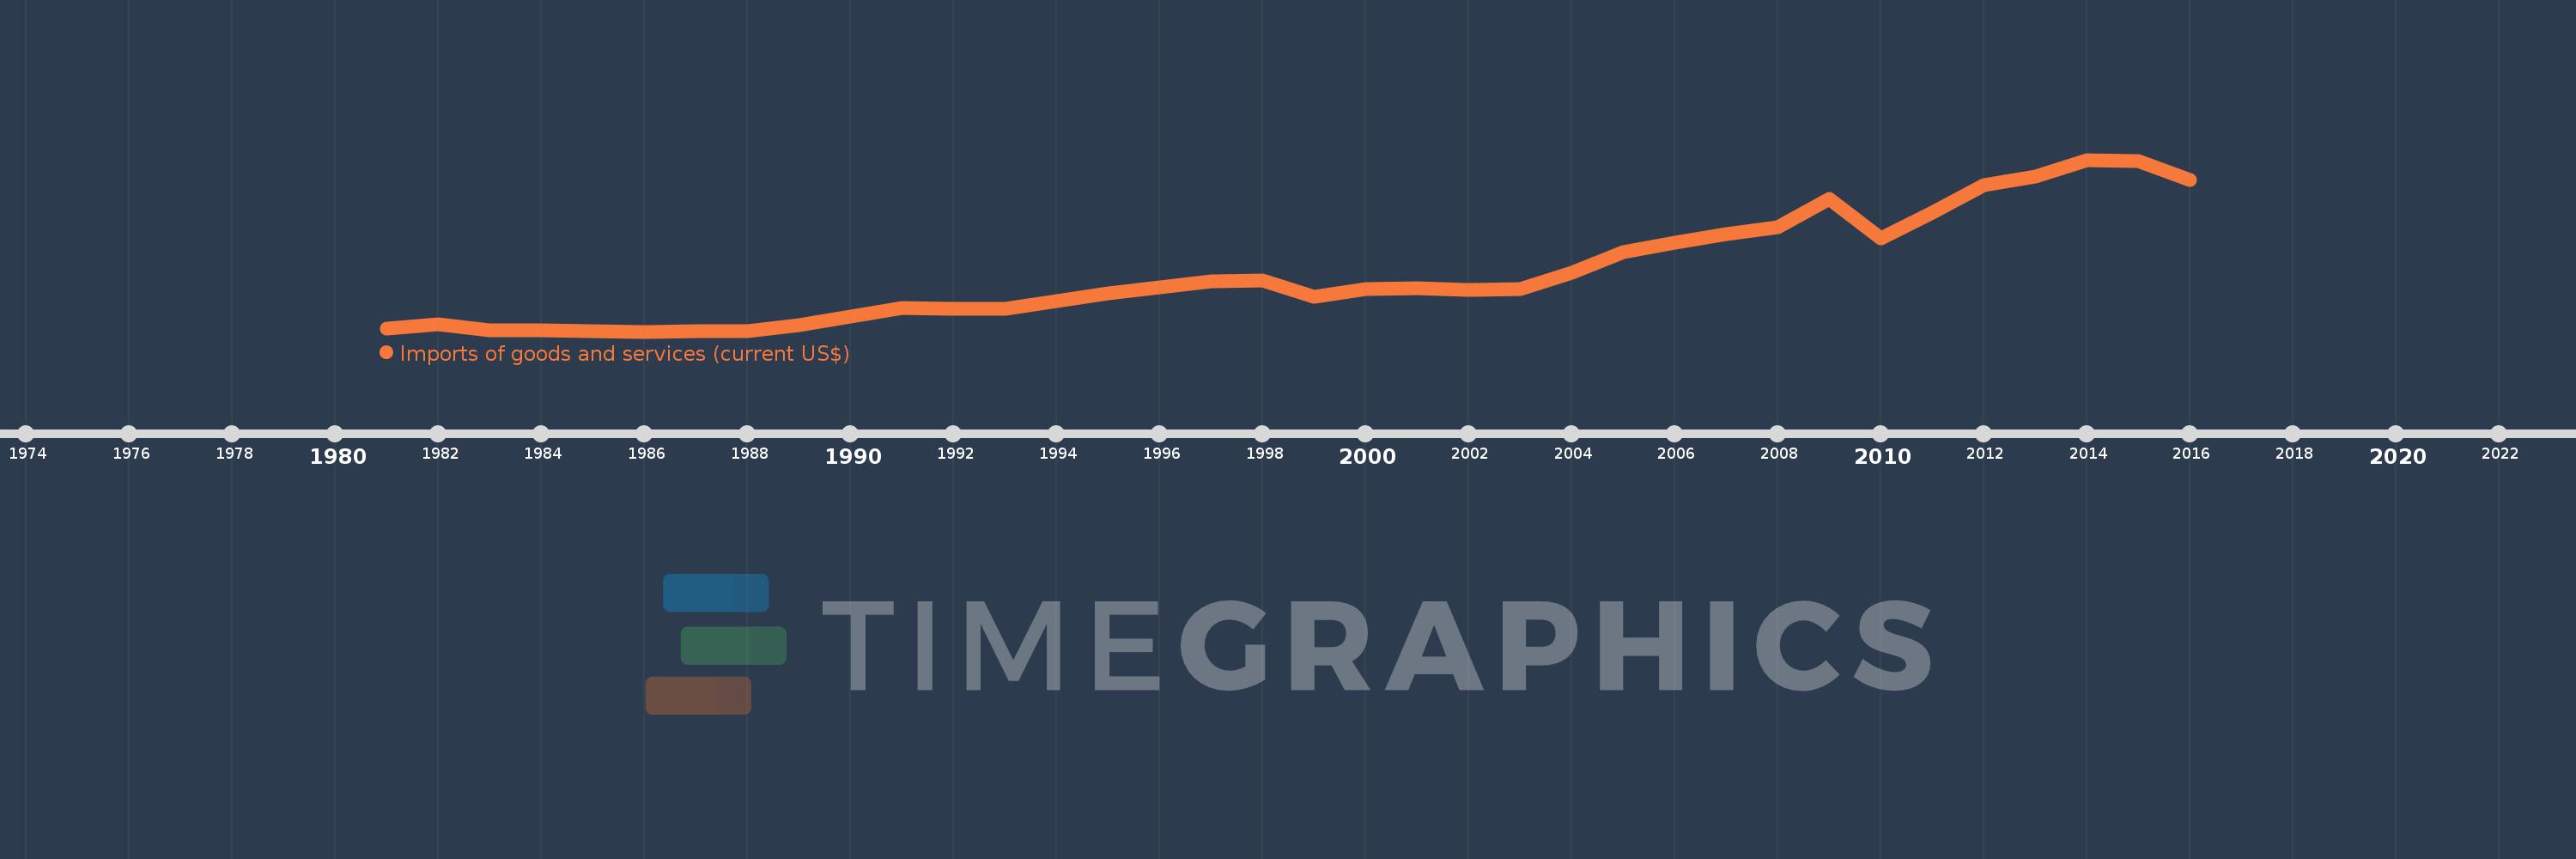
Imports of goods and services (current US$)
2016,2015,2014,2013,2012,2011,2010,2009,2008,2007,2006,2005,2004,2003,2002,2001,2000,1999,1998,1997,1996,1995,1994,1993,1992,1991,1990,1989,1988,1987,1986,1985,1984,1983,1982,1981
This statistics in other country:
AfghanistanAlbaniaAlgeriaAngolaAntigua and BarbudaArab WorldArgentinaArmeniaArubaAustraliaAustriaAzerbaijanBahamas, TheBahrainBangladeshBarbadosBelarusBelgiumBelizeBeninBermudaBhutanBoliviaBosnia and HerzegovinaBotswanaBrazilBrunei DarussalamBulgariaBurkina FasoBurundiCabo VerdeCambodiaCameroonCanadaCaribbean small statesCentral African RepublicCentral Europe and the BalticsChadChileChinaColombiaComorosCongo, Dem. Rep.Congo, Rep.Costa RicaCote d'IvoireCroatiaCubaCyprusCzech RepublicDenmarkDjiboutiDominicaDominican RepublicEarly-demographic dividendEast Asia & PacificEast Asia & Pacific (excluding high income)East Asia & Pacific (IDA & IBRD countries)EcuadorEgypt, Arab Rep.El SalvadorEquatorial GuineaEritreaEstoniaEthiopiaEuro areaEurope & Central AsiaEurope & Central Asia (excluding high income)Europe & Central Asia (IDA & IBRD countries)European UnionFaroe IslandsFijiFinlandFragile and conflict affected situationsFranceFrench PolynesiaGabonGambia, TheGeorgiaGermanyGhanaGreeceGrenadaGuatemalaGuineaGuinea-BissauGuyanaHaitiHeavily indebted poor countries (HIPC)High incomeHondurasHong Kong SAR, ChinaHungaryIBRD onlyIcelandIDA & IBRD totalIDA blendIDA onlyIDA totalIndiaIndonesiaIran, Islamic Rep.IraqIrelandIsraelItalyJamaicaJapanJordanKazakhstanKenyaKiribatiKorea, Rep.KosovoKuwaitKyrgyz RepublicLao PDRLate-demographic dividendLatin America & Caribbean Latin America & Caribbean (excluding high income)Latin America & the Caribbean (IDA & IBRD countries)LatviaLeast developed countries: UN classificationLebanonLesothoLiberiaLibyaLithuaniaLow & middle incomeLow incomeLower middle incomeLuxembourgMacao SAR, ChinaMacedonia, FYRMadagascarMalawiMalaysiaMaldivesMaliMaltaMauritaniaMauritiusMexicoMicronesia, Fed. Sts.Middle East & North AfricaMiddle East & North Africa (excluding high income)Middle East & North Africa (IDA & IBRD countries)Middle incomeMoldovaMongoliaMontenegroMoroccoMozambiqueMyanmarNamibiaNepalNetherlandsNew CaledoniaNew ZealandNicaraguaNigerNigeriaNorth AmericaNorwayOECD membersOmanOther small statesPacific island small statesPakistanPalauPanamaPapua New GuineaParaguayPeruPhilippinesPolandPortugalPost-demographic dividendPre-demographic dividendPuerto RicoQatarRomaniaRussian FederationRwandaSamoaSaudi ArabiaSenegalSerbiaSeychellesSierra LeoneSingaporeSlovak RepublicSloveniaSmall statesSolomon IslandsSomaliaSouth AfricaSouth AsiaSouth Asia (IDA & IBRD)South SudanSpainSri LankaSt. Kitts and NevisSt. LuciaSt. Vincent and the GrenadinesSub-Saharan Africa Sub-Saharan Africa (excluding high income)Sub-Saharan Africa (IDA & IBRD countries)SudanSurinameSwazilandSwedenSwitzerlandSyrian Arab RepublicTajikistanTanzaniaThailandTimor-LesteTogoTongaTrinidad and TobagoTunisiaTurkeyTurkmenistanUgandaUkraineUnited Arab EmiratesUnited KingdomUnited StatesUpper middle incomeUruguayUzbekistanVanuatuVenezuela, RBVietnamWest Bank and GazaWorldYemen, Rep.ZambiaZimbabwe Timeline:
This timeline shows a graph from 1981 to 2016 of Pacific island small states. No data until 1980. Number of actual observations by date: 36.
Source name:
World Development Indicators
Source organization:
World Bank national accounts data, and OECD National Accounts data files.
Categories, topics:
Economy & Growth, Trade
Last updated:
apr 23, 2017
Indicators value changes by year
Minimum:
974.226 mln
jan 1, 1986
Maximum:
5.698 bln
jan 1, 2014
At the date of observation
Value
Absolute change
Change from previous value
jan 1, 1981
1.06 bln
+1.06 bln
0.0%
jan 1, 1982
1.184 bln
+123.732 mln
11.67%
jan 1, 1983
1.002 bln
-181.232 mln
-15.31%
jan 1, 1984
998.968 mln
-3.514 mln
-0.35%
jan 1, 1985
981.969 mln
-16.999 mln
-1.7%
jan 1, 1986
974.226 mln
-7.742 mln
-0.79%
jan 1, 1987
981.5 mln
+7.274 mln
0.75%
jan 1, 1988
979.988 mln
-1.512 mln
-0.15%
jan 1, 1989
1.158 bln
+178.26 mln
18.19%
jan 1, 1990
1.383 bln
+224.812 mln
19.41%
jan 1, 1991
1.621 bln
+238.301 mln
17.23%
jan 1, 1992
1.605 bln
-16.745 mln
-1.03%
jan 1, 1993
1.606 bln
+1.213 mln
0.08%
jan 1, 1994
1.803 bln
+197.455 mln
12.3%
jan 1, 1995
2.024 bln
+221.041 mln
12.26%
jan 1, 1996
2.184 bln
+160.004 mln
7.9%
jan 1, 1997
2.349 bln
+164.557 mln
7.53%
jan 1, 1998
2.37 bln
+20.82 mln
0.89%
jan 1, 1999
1.93 bln
-439.321 mln
-18.54%
jan 1, 2000
2.142 bln
+211.127 mln
10.94%
jan 1, 2001
2.157 bln
+15.347 mln
0.72%
jan 1, 2002
2.114 bln
-43.042 mln
-2.0%
jan 1, 2003
2.133 bln
+18.851 mln
0.89%
jan 1, 2004
2.594 bln
+461.792 mln
21.65%
jan 1, 2005
3.156 bln
+561.457 mln
21.64%
jan 1, 2006
3.414 bln
+258.015 mln
8.18%
jan 1, 2007
3.658 bln
+244.155 mln
7.15%
jan 1, 2008
3.836 bln
+177.909 mln
4.86%
jan 1, 2009
4.632 bln
+796.143 mln
20.75%
jan 1, 2010
3.543 bln
-1.089 bln
-23.52%
jan 1, 2011
4.234 bln
+691.395 mln
19.52%
jan 1, 2012
4.997 bln
+762.975 mln
18.02%
jan 1, 2013
5.236 bln
+239.434 mln
4.79%
jan 1, 2014
5.698 bln
+461.692 mln
8.82%
jan 1, 2015
5.656 bln
-41.772 mln
-0.73%
jan 1, 2016
5.144 bln
-512.686 mln
-9.06%
Ranking of countries by current statistics by years


Comments: