29
/
en
AIzaSyAYiBZKx7MnpbEhh9jyipgxe19OcubqV5w
April 1, 2024
229883
Russian Federation
RUS
true
2
1
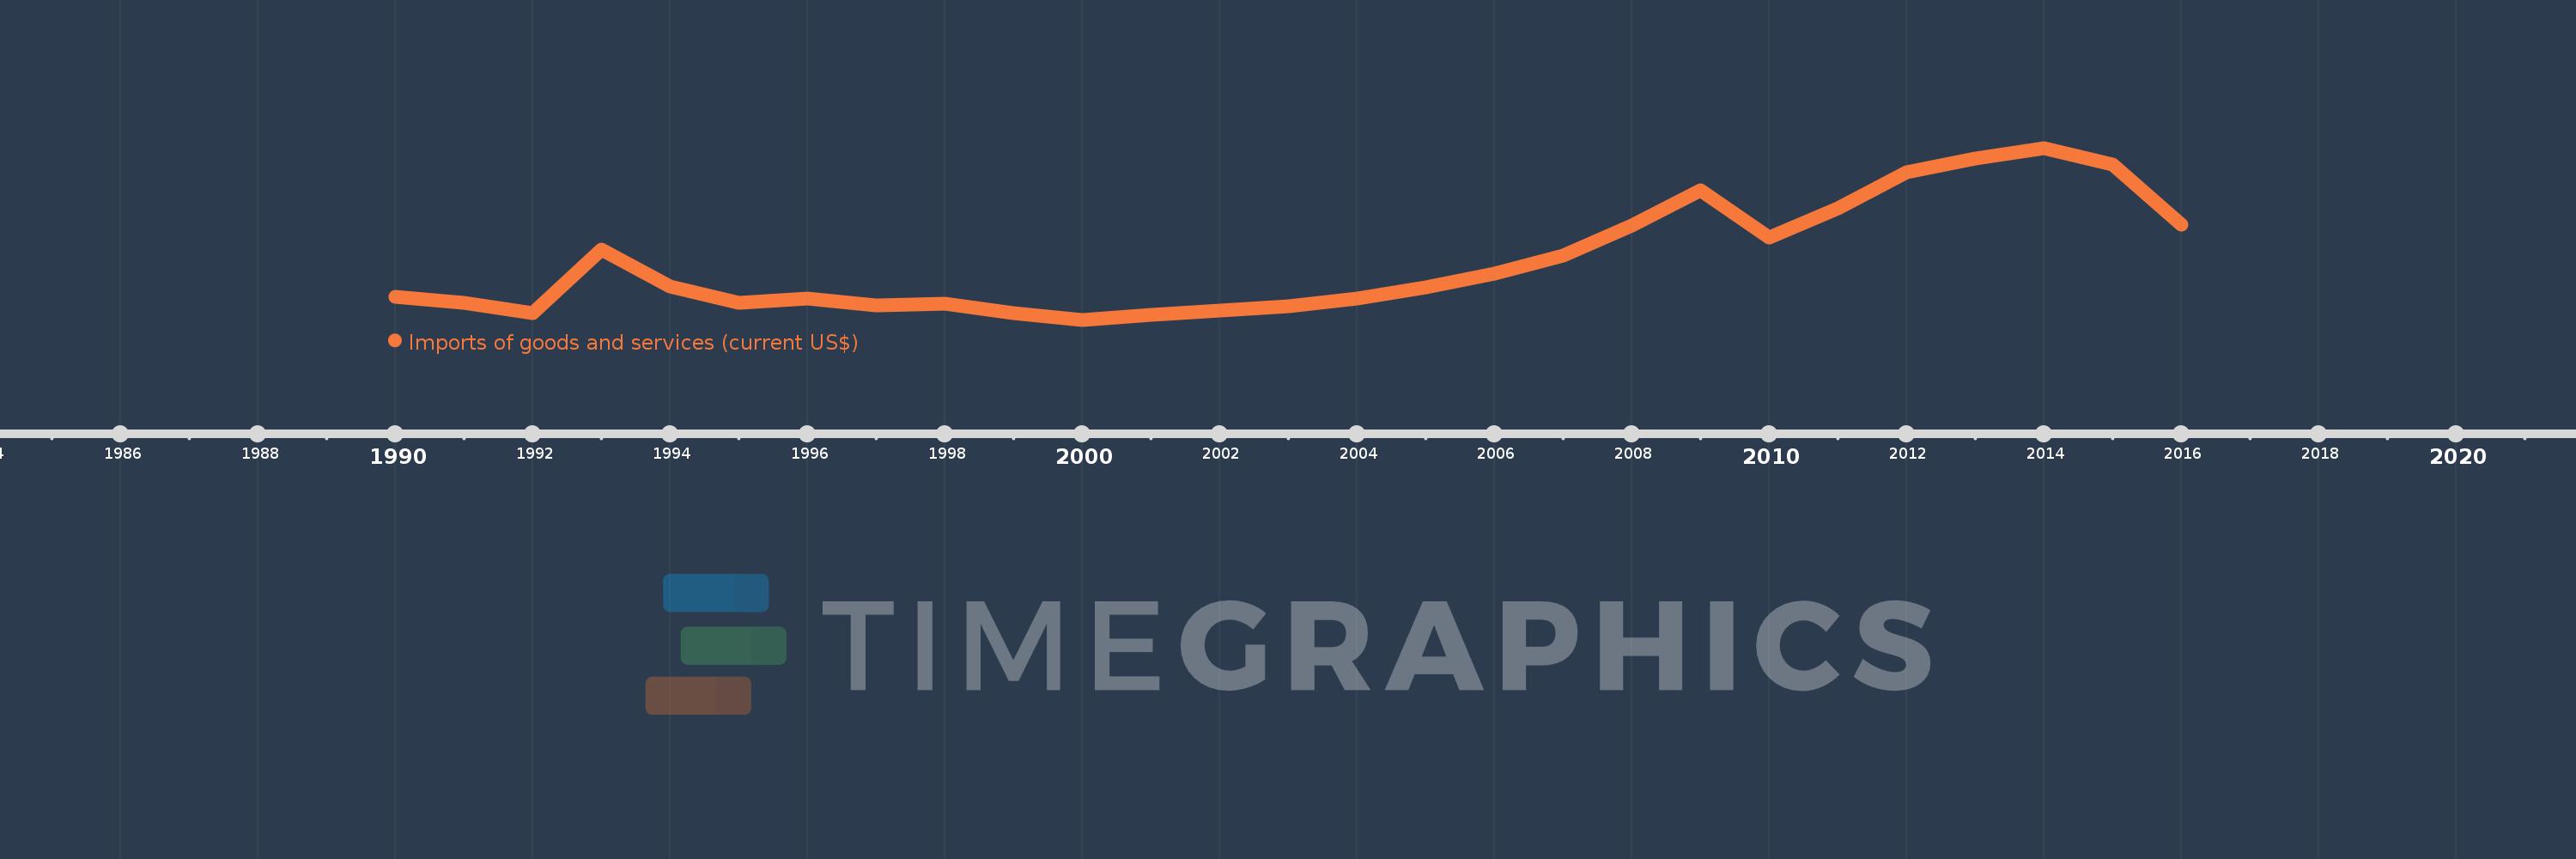
Imports of goods and services (current US$)
2016,2015,2014,2013,2012,2011,2010,2009,2008,2007,2006,2005,2004,2003,2002,2001,2000,1999,1998,1997,1996,1995,1994,1993,1992,1991,1990
This statistics in other country:
AfghanistanAlbaniaAlgeriaAngolaAntigua and BarbudaArab WorldArgentinaArmeniaArubaAustraliaAustriaAzerbaijanBahamas, TheBahrainBangladeshBarbadosBelarusBelgiumBelizeBeninBermudaBhutanBoliviaBosnia and HerzegovinaBotswanaBrazilBrunei DarussalamBulgariaBurkina FasoBurundiCabo VerdeCambodiaCameroonCanadaCaribbean small statesCentral African RepublicCentral Europe and the BalticsChadChileChinaColombiaComorosCongo, Dem. Rep.Congo, Rep.Costa RicaCote d'IvoireCroatiaCubaCyprusCzech RepublicDenmarkDjiboutiDominicaDominican RepublicEarly-demographic dividendEast Asia & PacificEast Asia & Pacific (excluding high income)East Asia & Pacific (IDA & IBRD countries)EcuadorEgypt, Arab Rep.El SalvadorEquatorial GuineaEritreaEstoniaEthiopiaEuro areaEurope & Central AsiaEurope & Central Asia (excluding high income)Europe & Central Asia (IDA & IBRD countries)European UnionFaroe IslandsFijiFinlandFragile and conflict affected situationsFranceFrench PolynesiaGabonGambia, TheGeorgiaGermanyGhanaGreeceGrenadaGuatemalaGuineaGuinea-BissauGuyanaHaitiHeavily indebted poor countries (HIPC)High incomeHondurasHong Kong SAR, ChinaHungaryIBRD onlyIcelandIDA & IBRD totalIDA blendIDA onlyIDA totalIndiaIndonesiaIran, Islamic Rep.IraqIrelandIsraelItalyJamaicaJapanJordanKazakhstanKenyaKiribatiKorea, Rep.KosovoKuwaitKyrgyz RepublicLao PDRLate-demographic dividendLatin America & Caribbean Latin America & Caribbean (excluding high income)Latin America & the Caribbean (IDA & IBRD countries)LatviaLeast developed countries: UN classificationLebanonLesothoLiberiaLibyaLithuaniaLow & middle incomeLow incomeLower middle incomeLuxembourgMacao SAR, ChinaMacedonia, FYRMadagascarMalawiMalaysiaMaldivesMaliMaltaMauritaniaMauritiusMexicoMicronesia, Fed. Sts.Middle East & North AfricaMiddle East & North Africa (excluding high income)Middle East & North Africa (IDA & IBRD countries)Middle incomeMoldovaMongoliaMontenegroMoroccoMozambiqueMyanmarNamibiaNepalNetherlandsNew CaledoniaNew ZealandNicaraguaNigerNigeriaNorth AmericaNorwayOECD membersOmanOther small statesPacific island small statesPakistanPalauPanamaPapua New GuineaParaguayPeruPhilippinesPolandPortugalPost-demographic dividendPre-demographic dividendPuerto RicoQatarRomaniaRussian FederationRwandaSamoaSaudi ArabiaSenegalSerbiaSeychellesSierra LeoneSingaporeSlovak RepublicSloveniaSmall statesSolomon IslandsSomaliaSouth AfricaSouth AsiaSouth Asia (IDA & IBRD)South SudanSpainSri LankaSt. Kitts and NevisSt. LuciaSt. Vincent and the GrenadinesSub-Saharan Africa Sub-Saharan Africa (excluding high income)Sub-Saharan Africa (IDA & IBRD countries)SudanSurinameSwazilandSwedenSwitzerlandSyrian Arab RepublicTajikistanTanzaniaThailandTimor-LesteTogoTongaTrinidad and TobagoTunisiaTurkeyTurkmenistanUgandaUkraineUnited Arab EmiratesUnited KingdomUnited StatesUpper middle incomeUruguayUzbekistanVanuatuVenezuela, RBVietnamWest Bank and GazaWorldYemen, Rep.ZambiaZimbabwe Timeline:
This timeline shows a graph from 1990 to 2016 of Russian Federation. No data until 1989. Number of actual observations by date: 27.
Source name:
World Development Indicators
Source organization:
World Bank national accounts data, and OECD National Accounts data files.
Categories, topics:
Economy & Growth, Trade
Last updated:
apr 23, 2017
Indicators value changes by year
Minimum:
51.275 bln
jan 1, 2000
Maximum:
468.916 bln
jan 1, 2014
At the date of observation
Value
Absolute change
Change from previous value
jan 1, 1990
106.427 bln
+106.427 bln
0.0%
jan 1, 1991
92.741 bln
-13.686 bln
-12.86%
jan 1, 1992
67.259 bln
-25.482 bln
-27.48%
jan 1, 1993
222.111 bln
+154.852 bln
230.23%
jan 1, 1994
132.674 bln
-89.438 bln
-40.27%
jan 1, 1995
91.639 bln
-41.034 bln
-30.93%
jan 1, 1996
102.42 bln
+10.78 bln
11.76%
jan 1, 1997
85.59 bln
-16.83 bln
-16.43%
jan 1, 1998
91.219 bln
+5.629 bln
6.58%
jan 1, 1999
66.522 bln
-24.696 bln
-27.07%
jan 1, 2000
51.275 bln
-15.247 bln
-22.92%
jan 1, 2001
62.417 bln
+11.142 bln
21.73%
jan 1, 2002
74.251 bln
+11.834 bln
18.96%
jan 1, 2003
84.408 bln
+10.157 bln
13.68%
jan 1, 2004
102.76 bln
+18.351 bln
21.74%
jan 1, 2005
130.993 bln
+28.233 bln
27.47%
jan 1, 2006
164.341 bln
+33.349 bln
25.46%
jan 1, 2007
207.914 bln
+43.573 bln
26.51%
jan 1, 2008
279.983 bln
+72.069 bln
34.66%
jan 1, 2009
366.597 bln
+86.614 bln
30.94%
jan 1, 2010
250.605 bln
-115.992 bln
-31.64%
jan 1, 2011
322.367 bln
+71.762 bln
28.64%
jan 1, 2012
409.227 bln
+86.86 bln
26.94%
jan 1, 2013
443.737 bln
+34.51 bln
8.43%
jan 1, 2014
468.916 bln
+25.179 bln
5.67%
jan 1, 2015
429.191 bln
-39.724 bln
-8.47%
jan 1, 2016
282.298 bln
-146.893 bln
-34.23%
Ranking of countries by current statistics by years


Comments: