29
/
en
AIzaSyAYiBZKx7MnpbEhh9jyipgxe19OcubqV5w
April 1, 2024
108638
Comoros
COM
true
2
1
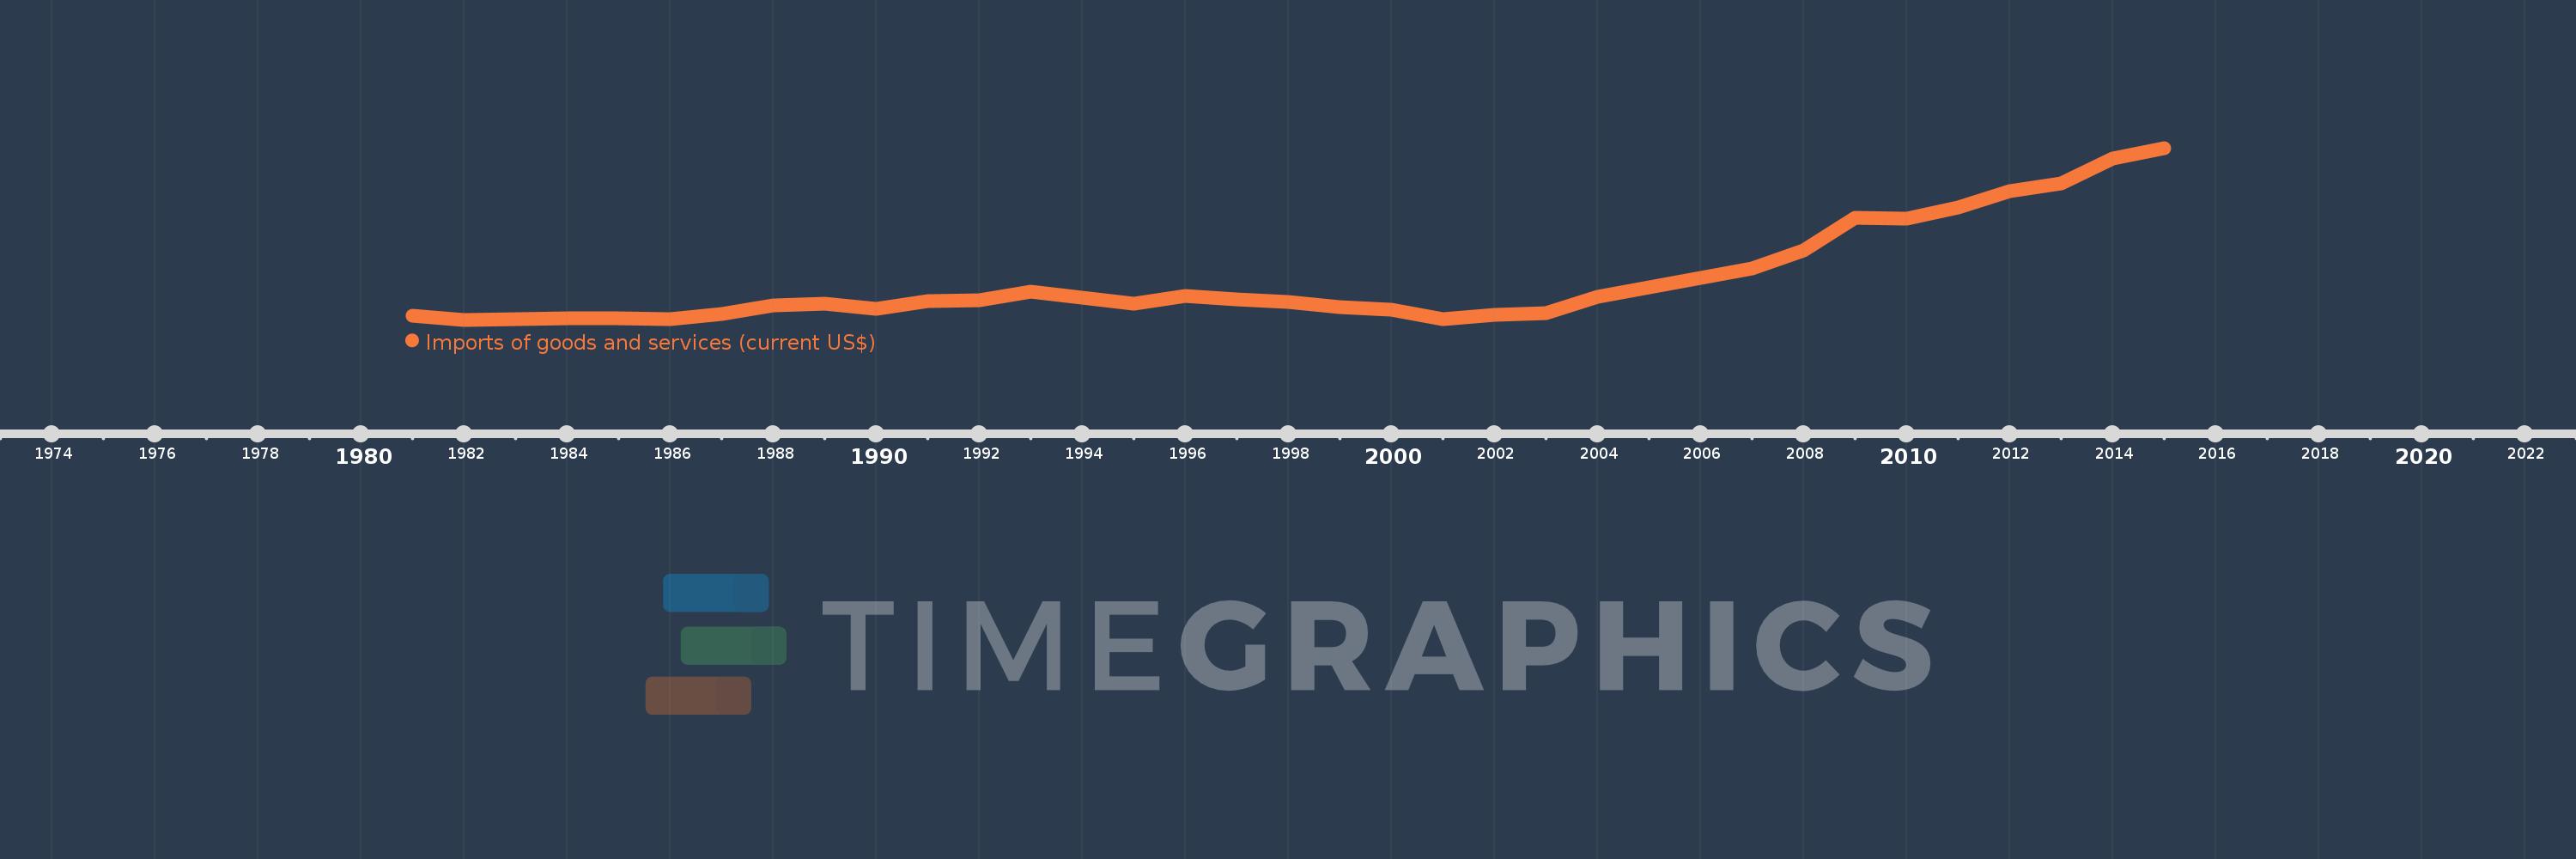
Imports of goods and services (current US$)
2015,2014,2013,2012,2011,2010,2009,2008,2007,2006,2005,2004,2003,2002,2001,2000,1999,1998,1997,1996,1995,1994,1993,1992,1991,1990,1989,1988,1987,1986,1985,1984,1983,1982,1981
This statistics in other country:
AfghanistanAlbaniaAlgeriaAngolaAntigua and BarbudaArab WorldArgentinaArmeniaArubaAustraliaAustriaAzerbaijanBahamas, TheBahrainBangladeshBarbadosBelarusBelgiumBelizeBeninBermudaBhutanBoliviaBosnia and HerzegovinaBotswanaBrazilBrunei DarussalamBulgariaBurkina FasoBurundiCabo VerdeCambodiaCameroonCanadaCaribbean small statesCentral African RepublicCentral Europe and the BalticsChadChileChinaColombiaComorosCongo, Dem. Rep.Congo, Rep.Costa RicaCote d'IvoireCroatiaCubaCyprusCzech RepublicDenmarkDjiboutiDominicaDominican RepublicEarly-demographic dividendEast Asia & PacificEast Asia & Pacific (excluding high income)East Asia & Pacific (IDA & IBRD countries)EcuadorEgypt, Arab Rep.El SalvadorEquatorial GuineaEritreaEstoniaEthiopiaEuro areaEurope & Central AsiaEurope & Central Asia (excluding high income)Europe & Central Asia (IDA & IBRD countries)European UnionFaroe IslandsFijiFinlandFragile and conflict affected situationsFranceFrench PolynesiaGabonGambia, TheGeorgiaGermanyGhanaGreeceGrenadaGuatemalaGuineaGuinea-BissauGuyanaHaitiHeavily indebted poor countries (HIPC)High incomeHondurasHong Kong SAR, ChinaHungaryIBRD onlyIcelandIDA & IBRD totalIDA blendIDA onlyIDA totalIndiaIndonesiaIran, Islamic Rep.IraqIrelandIsraelItalyJamaicaJapanJordanKazakhstanKenyaKiribatiKorea, Rep.KosovoKuwaitKyrgyz RepublicLao PDRLate-demographic dividendLatin America & Caribbean Latin America & Caribbean (excluding high income)Latin America & the Caribbean (IDA & IBRD countries)LatviaLeast developed countries: UN classificationLebanonLesothoLiberiaLibyaLithuaniaLow & middle incomeLow incomeLower middle incomeLuxembourgMacao SAR, ChinaMacedonia, FYRMadagascarMalawiMalaysiaMaldivesMaliMaltaMauritaniaMauritiusMexicoMicronesia, Fed. Sts.Middle East & North AfricaMiddle East & North Africa (excluding high income)Middle East & North Africa (IDA & IBRD countries)Middle incomeMoldovaMongoliaMontenegroMoroccoMozambiqueMyanmarNamibiaNepalNetherlandsNew CaledoniaNew ZealandNicaraguaNigerNigeriaNorth AmericaNorwayOECD membersOmanOther small statesPacific island small statesPakistanPalauPanamaPapua New GuineaParaguayPeruPhilippinesPolandPortugalPost-demographic dividendPre-demographic dividendPuerto RicoQatarRomaniaRussian FederationRwandaSamoaSaudi ArabiaSenegalSerbiaSeychellesSierra LeoneSingaporeSlovak RepublicSloveniaSmall statesSolomon IslandsSomaliaSouth AfricaSouth AsiaSouth Asia (IDA & IBRD)South SudanSpainSri LankaSt. Kitts and NevisSt. LuciaSt. Vincent and the GrenadinesSub-Saharan Africa Sub-Saharan Africa (excluding high income)Sub-Saharan Africa (IDA & IBRD countries)SudanSurinameSwazilandSwedenSwitzerlandSyrian Arab RepublicTajikistanTanzaniaThailandTimor-LesteTogoTongaTrinidad and TobagoTunisiaTurkeyTurkmenistanUgandaUkraineUnited Arab EmiratesUnited KingdomUnited StatesUpper middle incomeUruguayUzbekistanVanuatuVenezuela, RBVietnamWest Bank and GazaWorldYemen, Rep.ZambiaZimbabwe Timeline:
This timeline shows a graph from 1981 to 2015 of Comoros. No data until 1980. Number of actual observations by date: 35.
Source name:
World Development Indicators
Source organization:
World Bank national accounts data, and OECD National Accounts data files.
Categories, topics:
Economy & Growth, Trade
Last updated:
apr 23, 2017
Indicators value changes by year
Minimum:
56.236 mln
jan 1, 1982
Maximum:
390.568 mln
jan 1, 2015
At the date of observation
Value
Absolute change
Change from previous value
jan 1, 1981
64.153 mln
+64.153 mln
0.0%
jan 1, 1982
56.236 mln
-7.916 mln
-12.34%
jan 1, 1983
57.656 mln
+1.42 mln
2.52%
jan 1, 1984
59.867 mln
+2.211 mln
3.83%
jan 1, 1985
59.695 mln
-171.565K
-0.29%
jan 1, 1986
57.312 mln
-2.383 mln
-3.99%
jan 1, 1987
67.421 mln
+10.109 mln
17.64%
jan 1, 1988
83.485 mln
+16.064 mln
23.83%
jan 1, 1989
86.666 mln
+3.181 mln
3.81%
jan 1, 1990
78.08 mln
-8.586 mln
-9.91%
jan 1, 1991
92.877 mln
+14.797 mln
18.95%
jan 1, 1992
94.305 mln
+1.428 mln
1.54%
jan 1, 1993
111.402 mln
+17.097 mln
18.13%
jan 1, 1994
99.396 mln
-12.006 mln
-10.78%
jan 1, 1995
87.769 mln
-11.627 mln
-11.7%
jan 1, 1996
103.348 mln
+15.579 mln
17.75%
jan 1, 1997
95.381 mln
-7.967 mln
-7.71%
jan 1, 1998
91.254 mln
-4.128 mln
-4.33%
jan 1, 1999
80.249 mln
-11.004 mln
-12.06%
jan 1, 2000
75.485 mln
-4.764 mln
-5.94%
jan 1, 2001
57.302 mln
-18.183 mln
-24.09%
jan 1, 2002
64.979 mln
+7.677 mln
13.4%
jan 1, 2003
69.492 mln
+4.513 mln
6.95%
jan 1, 2004
101.202 mln
+31.71 mln
45.63%
jan 1, 2005
119.511 mln
+18.309 mln
18.09%
jan 1, 2006
138.382 mln
+18.871 mln
15.79%
jan 1, 2007
155.668 mln
+17.286 mln
12.49%
jan 1, 2008
191.351 mln
+35.683 mln
22.92%
jan 1, 2009
255.326 mln
+63.975 mln
33.43%
jan 1, 2010
253.617 mln
-1.708 mln
-0.67%
jan 1, 2011
274.156 mln
+20.538 mln
8.1%
jan 1, 2012
306.255 mln
+32.1 mln
11.71%
jan 1, 2013
321.497 mln
+15.242 mln
4.98%
jan 1, 2014
370.281 mln
+48.784 mln
15.17%
jan 1, 2015
390.568 mln
+20.287 mln
5.48%
Ranking of countries by current statistics by years


Comments: