29
/
en
AIzaSyAYiBZKx7MnpbEhh9jyipgxe19OcubqV5w
April 1, 2024
123623
Ecuador
ECU
true
2
1
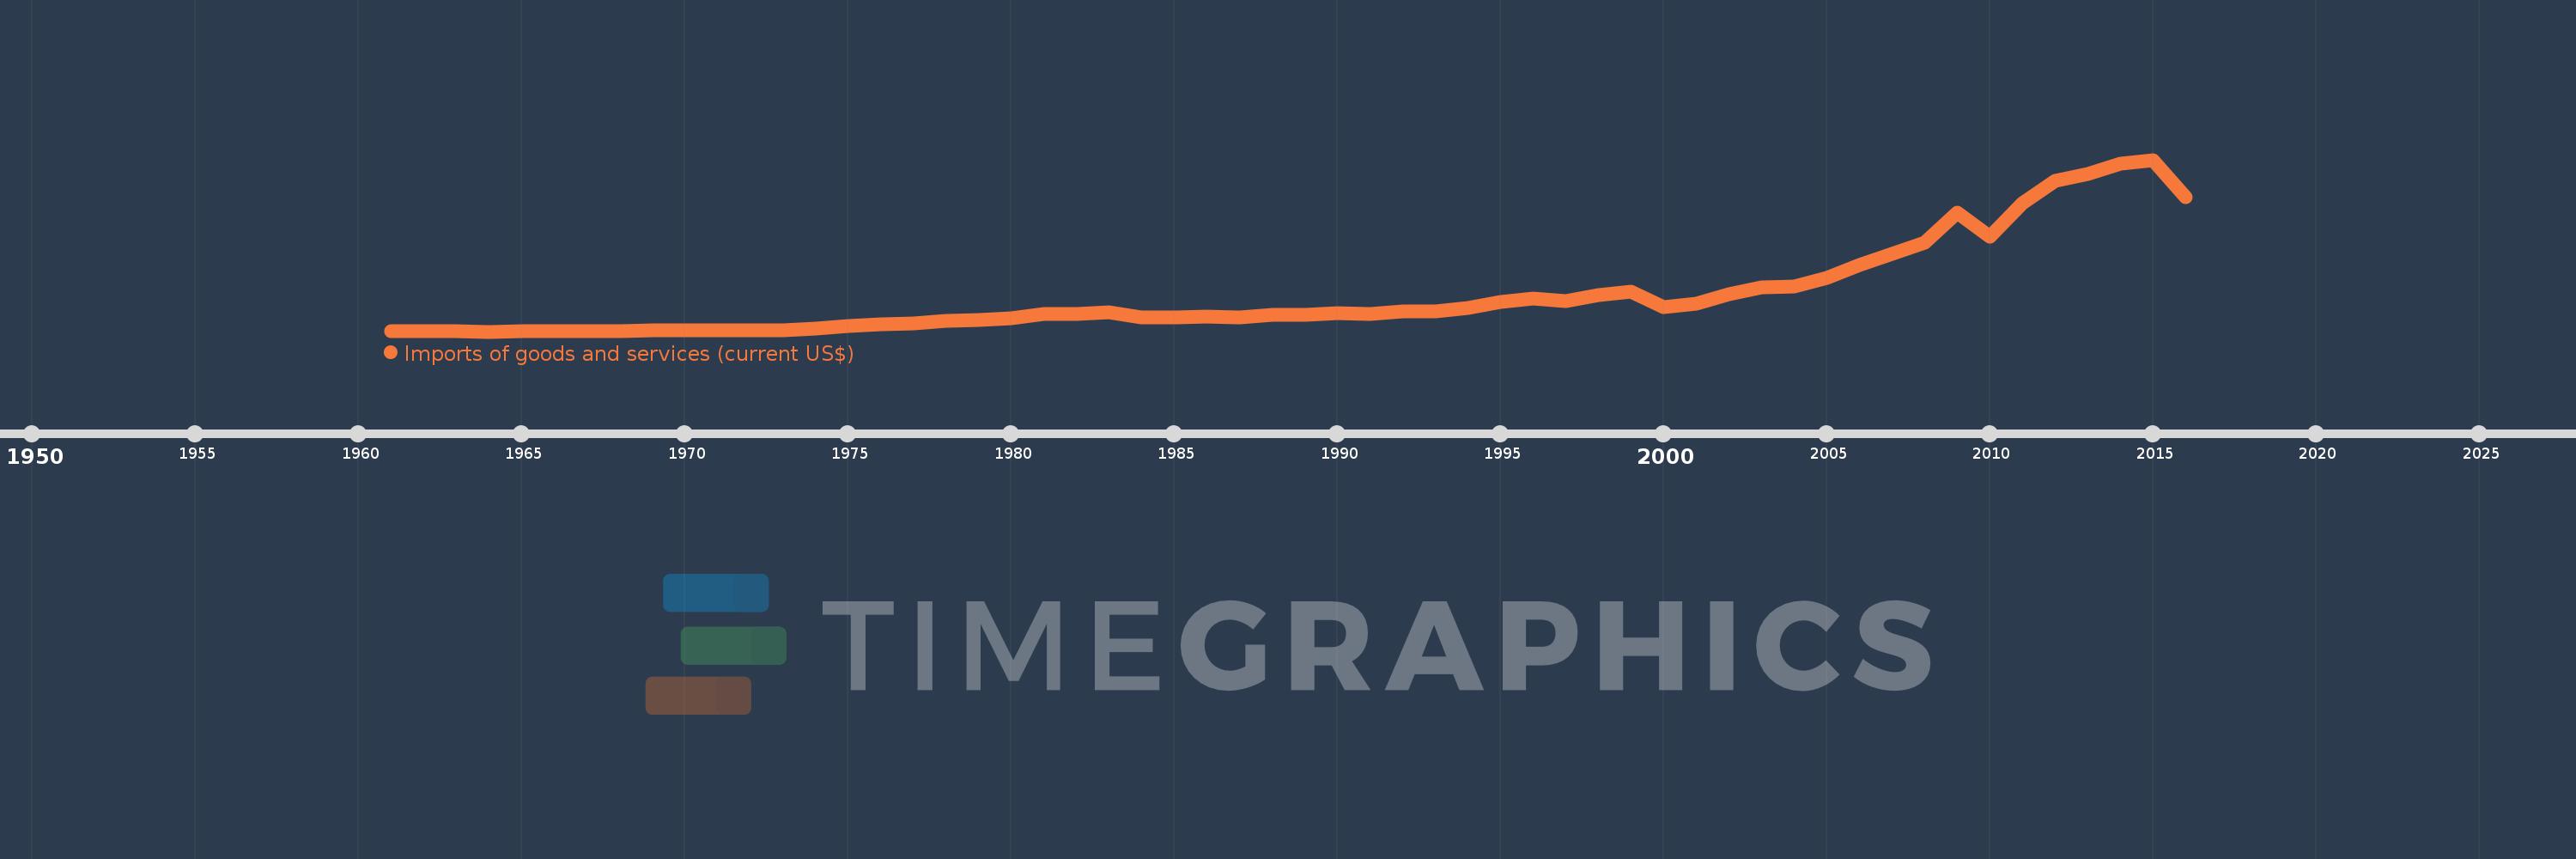
Imports of goods and services (current US$)
2016,2015,2014,2013,2012,2011,2010,2009,2008,2007,2006,2005,2004,2003,2002,2001,2000,1999,1998,1997,1996,1995,1994,1993,1992,1991,1990,1989,1988,1987,1986,1985,1984,1983,1982,1981,1980,1979,1978,1977,1976,1975,1974,1973,1972,1971,1970,1969,1968,1967,1966,1965,1964,1963,1962,1961
This statistics in other country:
AfghanistanAlbaniaAlgeriaAngolaAntigua and BarbudaArab WorldArgentinaArmeniaArubaAustraliaAustriaAzerbaijanBahamas, TheBahrainBangladeshBarbadosBelarusBelgiumBelizeBeninBermudaBhutanBoliviaBosnia and HerzegovinaBotswanaBrazilBrunei DarussalamBulgariaBurkina FasoBurundiCabo VerdeCambodiaCameroonCanadaCaribbean small statesCentral African RepublicCentral Europe and the BalticsChadChileChinaColombiaComorosCongo, Dem. Rep.Congo, Rep.Costa RicaCote d'IvoireCroatiaCubaCyprusCzech RepublicDenmarkDjiboutiDominicaDominican RepublicEarly-demographic dividendEast Asia & PacificEast Asia & Pacific (excluding high income)East Asia & Pacific (IDA & IBRD countries)EcuadorEgypt, Arab Rep.El SalvadorEquatorial GuineaEritreaEstoniaEthiopiaEuro areaEurope & Central AsiaEurope & Central Asia (excluding high income)Europe & Central Asia (IDA & IBRD countries)European UnionFaroe IslandsFijiFinlandFragile and conflict affected situationsFranceFrench PolynesiaGabonGambia, TheGeorgiaGermanyGhanaGreeceGrenadaGuatemalaGuineaGuinea-BissauGuyanaHaitiHeavily indebted poor countries (HIPC)High incomeHondurasHong Kong SAR, ChinaHungaryIBRD onlyIcelandIDA & IBRD totalIDA blendIDA onlyIDA totalIndiaIndonesiaIran, Islamic Rep.IraqIrelandIsraelItalyJamaicaJapanJordanKazakhstanKenyaKiribatiKorea, Rep.KosovoKuwaitKyrgyz RepublicLao PDRLate-demographic dividendLatin America & Caribbean Latin America & Caribbean (excluding high income)Latin America & the Caribbean (IDA & IBRD countries)LatviaLeast developed countries: UN classificationLebanonLesothoLiberiaLibyaLithuaniaLow & middle incomeLow incomeLower middle incomeLuxembourgMacao SAR, ChinaMacedonia, FYRMadagascarMalawiMalaysiaMaldivesMaliMaltaMauritaniaMauritiusMexicoMicronesia, Fed. Sts.Middle East & North AfricaMiddle East & North Africa (excluding high income)Middle East & North Africa (IDA & IBRD countries)Middle incomeMoldovaMongoliaMontenegroMoroccoMozambiqueMyanmarNamibiaNepalNetherlandsNew CaledoniaNew ZealandNicaraguaNigerNigeriaNorth AmericaNorwayOECD membersOmanOther small statesPacific island small statesPakistanPalauPanamaPapua New GuineaParaguayPeruPhilippinesPolandPortugalPost-demographic dividendPre-demographic dividendPuerto RicoQatarRomaniaRussian FederationRwandaSamoaSaudi ArabiaSenegalSerbiaSeychellesSierra LeoneSingaporeSlovak RepublicSloveniaSmall statesSolomon IslandsSomaliaSouth AfricaSouth AsiaSouth Asia (IDA & IBRD)South SudanSpainSri LankaSt. Kitts and NevisSt. LuciaSt. Vincent and the GrenadinesSub-Saharan Africa Sub-Saharan Africa (excluding high income)Sub-Saharan Africa (IDA & IBRD countries)SudanSurinameSwazilandSwedenSwitzerlandSyrian Arab RepublicTajikistanTanzaniaThailandTimor-LesteTogoTongaTrinidad and TobagoTunisiaTurkeyTurkmenistanUgandaUkraineUnited Arab EmiratesUnited KingdomUnited StatesUpper middle incomeUruguayUzbekistanVanuatuVenezuela, RBVietnamWest Bank and GazaWorldYemen, Rep.ZambiaZimbabwe Timeline:
This timeline shows a graph from 1961 to 2016 of Ecuador. No data until 1960. Number of actual observations by date: 56.
Source name:
World Development Indicators
Source organization:
World Bank national accounts data, and OECD National Accounts data files.
Categories, topics:
Economy & Growth, Trade
Last updated:
apr 23, 2017
Indicators value changes by year
Minimum:
196.356 mln
jan 1, 1964
Maximum:
30.174 bln
jan 1, 2015
At the date of observation
Value
Absolute change
Change from previous value
jan 1, 1961
196.894 mln
+196.894 mln
0.0%
jan 1, 1962
200.269 mln
+3.374 mln
1.71%
jan 1, 1963
197.029 mln
-3.24 mln
-1.62%
jan 1, 1964
196.356 mln
-672.422K
-0.34%
jan 1, 1965
231.996 mln
+35.64 mln
18.15%
jan 1, 1966
245.639 mln
+13.642 mln
5.88%
jan 1, 1967
270.002 mln
+24.364 mln
9.92%
jan 1, 1968
307.238 mln
+37.236 mln
13.79%
jan 1, 1969
359.393 mln
+52.155 mln
16.98%
jan 1, 1970
376.646 mln
+17.252 mln
4.8%
jan 1, 1971
372.413 mln
-4.233 mln
-1.12%
jan 1, 1972
459.682 mln
+87.27 mln
23.43%
jan 1, 1973
495.423 mln
+35.741 mln
7.78%
jan 1, 1974
648.351 mln
+152.927 mln
30.87%
jan 1, 1975
1.238 bln
+589.163 mln
90.87%
jan 1, 1976
1.495 bln
+257.34 mln
20.79%
jan 1, 1977
1.635 bln
+139.716 mln
9.35%
jan 1, 1978
2.0 bln
+365.535 mln
22.36%
jan 1, 1979
2.213 bln
+213.169 mln
10.66%
jan 1, 1980
2.576 bln
+362.566 mln
16.38%
jan 1, 1981
3.197 bln
+620.835 mln
24.1%
jan 1, 1982
3.336 bln
+139.811 mln
4.37%
jan 1, 1983
3.539 bln
+202.349 mln
6.06%
jan 1, 1984
2.627 bln
-911.692 mln
-25.76%
jan 1, 1985
2.652 bln
+25.057 mln
0.95%
jan 1, 1986
2.75 bln
+97.818 mln
3.69%
jan 1, 1987
2.677 bln
-72.922 mln
-2.65%
jan 1, 1988
3.119 bln
+441.749 mln
16.5%
jan 1, 1989
3.088 bln
-31.232 mln
-1.0%
jan 1, 1990
3.449 bln
+361.47 mln
11.71%
jan 1, 1991
3.327 bln
-122.267 mln
-3.54%
jan 1, 1992
3.656 bln
+329.465 mln
9.9%
jan 1, 1993
3.741 bln
+84.304 mln
2.31%
jan 1, 1994
4.382 bln
+640.957 mln
17.14%
jan 1, 1995
5.336 bln
+954.524 mln
21.79%
jan 1, 1996
6.016 bln
+680.375 mln
12.75%
jan 1, 1997
5.535 bln
-481.163 mln
-8.0%
jan 1, 1998
6.613 bln
+1.078 bln
19.47%
jan 1, 1999
7.136 bln
+523.181 mln
7.91%
jan 1, 2000
4.484 bln
-2.652 bln
-37.17%
jan 1, 2001
5.01 bln
+526.511 mln
11.74%
jan 1, 2002
6.734 bln
+1.724 bln
34.41%
jan 1, 2003
7.961 bln
+1.226 bln
18.21%
jan 1, 2004
7.993 bln
+31.866 mln
0.4%
jan 1, 2005
9.554 bln
+1.562 bln
19.54%
jan 1, 2006
11.822 bln
+2.267 bln
23.73%
jan 1, 2007
13.749 bln
+1.927 bln
16.3%
jan 1, 2008
15.637 bln
+1.888 bln
13.73%
jan 1, 2009
20.933 bln
+5.297 bln
33.87%
jan 1, 2010
16.79 bln
-4.143 bln
-19.79%
jan 1, 2011
22.542 bln
+5.752 bln
34.26%
jan 1, 2012
26.454 bln
+3.912 bln
17.36%
jan 1, 2013
27.772 bln
+1.318 bln
4.98%
jan 1, 2014
29.46 bln
+1.688 bln
6.08%
jan 1, 2015
30.174 bln
+713.966 mln
2.42%
jan 1, 2016
23.703 bln
-6.471 bln
-21.45%
Ranking of countries by current statistics by years


Comments: