29
/
en
AIzaSyAYiBZKx7MnpbEhh9jyipgxe19OcubqV5w
April 1, 2024
102546
Central African Republic
CAF
true
2
1
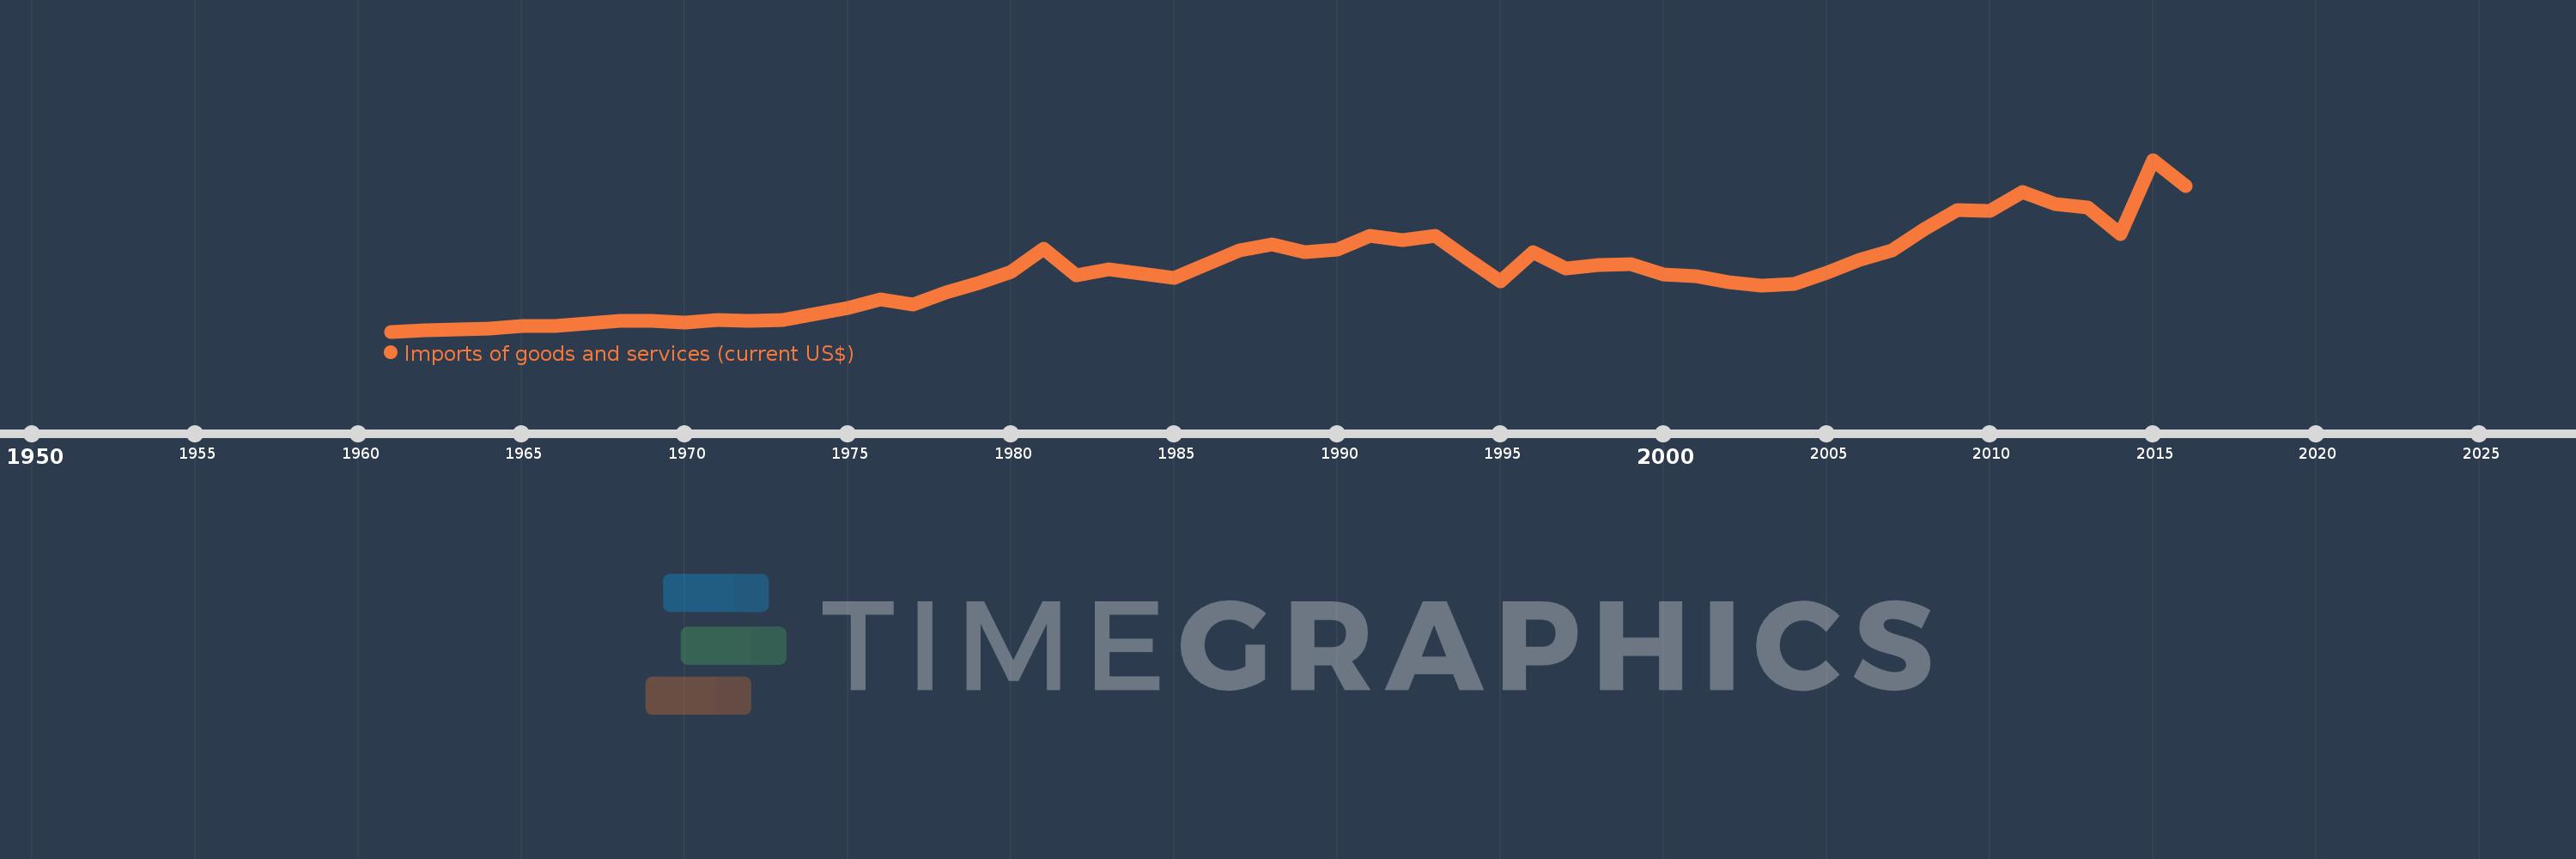
Imports of goods and services (current US$)
2016,2015,2014,2013,2012,2011,2010,2009,2008,2007,2006,2005,2004,2003,2002,2001,2000,1999,1998,1997,1996,1995,1994,1993,1992,1991,1990,1989,1988,1987,1986,1985,1984,1983,1982,1981,1980,1979,1978,1977,1976,1975,1974,1973,1972,1971,1970,1969,1968,1967,1966,1965,1964,1963,1962,1961
This statistics in other country:
AfghanistanAlbaniaAlgeriaAngolaAntigua and BarbudaArab WorldArgentinaArmeniaArubaAustraliaAustriaAzerbaijanBahamas, TheBahrainBangladeshBarbadosBelarusBelgiumBelizeBeninBermudaBhutanBoliviaBosnia and HerzegovinaBotswanaBrazilBrunei DarussalamBulgariaBurkina FasoBurundiCabo VerdeCambodiaCameroonCanadaCaribbean small statesCentral African RepublicCentral Europe and the BalticsChadChileChinaColombiaComorosCongo, Dem. Rep.Congo, Rep.Costa RicaCote d'IvoireCroatiaCubaCyprusCzech RepublicDenmarkDjiboutiDominicaDominican RepublicEarly-demographic dividendEast Asia & PacificEast Asia & Pacific (excluding high income)East Asia & Pacific (IDA & IBRD countries)EcuadorEgypt, Arab Rep.El SalvadorEquatorial GuineaEritreaEstoniaEthiopiaEuro areaEurope & Central AsiaEurope & Central Asia (excluding high income)Europe & Central Asia (IDA & IBRD countries)European UnionFaroe IslandsFijiFinlandFragile and conflict affected situationsFranceFrench PolynesiaGabonGambia, TheGeorgiaGermanyGhanaGreeceGrenadaGuatemalaGuineaGuinea-BissauGuyanaHaitiHeavily indebted poor countries (HIPC)High incomeHondurasHong Kong SAR, ChinaHungaryIBRD onlyIcelandIDA & IBRD totalIDA blendIDA onlyIDA totalIndiaIndonesiaIran, Islamic Rep.IraqIrelandIsraelItalyJamaicaJapanJordanKazakhstanKenyaKiribatiKorea, Rep.KosovoKuwaitKyrgyz RepublicLao PDRLate-demographic dividendLatin America & Caribbean Latin America & Caribbean (excluding high income)Latin America & the Caribbean (IDA & IBRD countries)LatviaLeast developed countries: UN classificationLebanonLesothoLiberiaLibyaLithuaniaLow & middle incomeLow incomeLower middle incomeLuxembourgMacao SAR, ChinaMacedonia, FYRMadagascarMalawiMalaysiaMaldivesMaliMaltaMauritaniaMauritiusMexicoMicronesia, Fed. Sts.Middle East & North AfricaMiddle East & North Africa (excluding high income)Middle East & North Africa (IDA & IBRD countries)Middle incomeMoldovaMongoliaMontenegroMoroccoMozambiqueMyanmarNamibiaNepalNetherlandsNew CaledoniaNew ZealandNicaraguaNigerNigeriaNorth AmericaNorwayOECD membersOmanOther small statesPacific island small statesPakistanPalauPanamaPapua New GuineaParaguayPeruPhilippinesPolandPortugalPost-demographic dividendPre-demographic dividendPuerto RicoQatarRomaniaRussian FederationRwandaSamoaSaudi ArabiaSenegalSerbiaSeychellesSierra LeoneSingaporeSlovak RepublicSloveniaSmall statesSolomon IslandsSomaliaSouth AfricaSouth AsiaSouth Asia (IDA & IBRD)South SudanSpainSri LankaSt. Kitts and NevisSt. LuciaSt. Vincent and the GrenadinesSub-Saharan Africa Sub-Saharan Africa (excluding high income)Sub-Saharan Africa (IDA & IBRD countries)SudanSurinameSwazilandSwedenSwitzerlandSyrian Arab RepublicTajikistanTanzaniaThailandTimor-LesteTogoTongaTrinidad and TobagoTunisiaTurkeyTurkmenistanUgandaUkraineUnited Arab EmiratesUnited KingdomUnited StatesUpper middle incomeUruguayUzbekistanVanuatuVenezuela, RBVietnamWest Bank and GazaWorldYemen, Rep.ZambiaZimbabwe Timeline:
This timeline shows a graph from 1961 to 2016 of Central African Republic. No data until 1960. Number of actual observations by date: 56.
Source name:
World Development Indicators
Source organization:
World Bank national accounts data, and OECD National Accounts data files.
Categories, topics:
Economy & Growth, Trade
Last updated:
apr 23, 2017
Indicators value changes by year
Minimum:
38.337 mln
jan 1, 1961
Maximum:
639.652 mln
jan 1, 2015
At the date of observation
Value
Absolute change
Change from previous value
jan 1, 1961
38.337 mln
+38.337 mln
0.0%
jan 1, 1962
44.035 mln
+5.698 mln
14.86%
jan 1, 1963
46.936 mln
+2.901 mln
6.59%
jan 1, 1964
49.793 mln
+2.856 mln
6.09%
jan 1, 1965
57.953 mln
+8.16 mln
16.39%
jan 1, 1966
56.721 mln
-1.232 mln
-2.13%
jan 1, 1967
67.161 mln
+10.44 mln
18.41%
jan 1, 1968
76.829 mln
+9.668 mln
14.4%
jan 1, 1969
76.0 mln
-829.161K
-1.08%
jan 1, 1970
70.7 mln
-5.3 mln
-6.97%
jan 1, 1971
78.597 mln
+7.897 mln
11.17%
jan 1, 1972
75.39 mln
-3.207 mln
-4.08%
jan 1, 1973
77.878 mln
+2.488 mln
3.3%
jan 1, 1974
98.946 mln
+21.069 mln
27.05%
jan 1, 1975
121.947 mln
+23.001 mln
23.25%
jan 1, 1976
151.161 mln
+29.214 mln
23.96%
jan 1, 1977
132.308 mln
-18.853 mln
-12.47%
jan 1, 1978
174.13 mln
+41.822 mln
31.61%
jan 1, 1979
206.899 mln
+32.77 mln
18.82%
jan 1, 1980
246.199 mln
+39.3 mln
18.99%
jan 1, 1981
327.434 mln
+81.234 mln
33.0%
jan 1, 1982
236.648 mln
-90.785 mln
-27.73%
jan 1, 1983
256.106 mln
+19.458 mln
8.22%
jan 1, 1984
241.184 mln
-14.922 mln
-5.83%
jan 1, 1985
226.437 mln
-14.747 mln
-6.11%
jan 1, 1986
273.604 mln
+47.167 mln
20.83%
jan 1, 1987
321.222 mln
+47.618 mln
17.4%
jan 1, 1988
342.887 mln
+21.665 mln
6.74%
jan 1, 1989
316.906 mln
-25.98 mln
-7.58%
jan 1, 1990
326.537 mln
+9.631 mln
3.04%
jan 1, 1991
372.791 mln
+46.255 mln
14.17%
jan 1, 1992
359.807 mln
-12.985 mln
-3.48%
jan 1, 1993
372.229 mln
+12.422 mln
3.45%
jan 1, 1994
292.701 mln
-79.528 mln
-21.37%
jan 1, 1995
212.952 mln
-79.749 mln
-27.25%
jan 1, 1996
315.153 mln
+102.201 mln
47.99%
jan 1, 1997
258.136 mln
-57.017 mln
-18.09%
jan 1, 1998
271.328 mln
+13.192 mln
5.11%
jan 1, 1999
274.653 mln
+3.325 mln
1.23%
jan 1, 2000
239.762 mln
-34.891 mln
-12.7%
jan 1, 2001
231.255 mln
-8.507 mln
-3.55%
jan 1, 2002
210.345 mln
-20.91 mln
-9.04%
jan 1, 2003
199.724 mln
-10.621 mln
-5.05%
jan 1, 2004
205.101 mln
+5.378 mln
2.69%
jan 1, 2005
244.44 mln
+39.339 mln
19.18%
jan 1, 2006
290.317 mln
+45.877 mln
18.77%
jan 1, 2007
322.49 mln
+32.173 mln
11.08%
jan 1, 2008
398.344 mln
+75.854 mln
23.52%
jan 1, 2009
465.249 mln
+66.906 mln
16.8%
jan 1, 2010
460.468 mln
-4.782 mln
-1.03%
jan 1, 2011
526.489 mln
+66.021 mln
14.34%
jan 1, 2012
483.637 mln
-42.851 mln
-8.14%
jan 1, 2013
472.608 mln
-11.03 mln
-2.28%
jan 1, 2014
379.716 mln
-92.891 mln
-19.66%
jan 1, 2015
639.652 mln
+259.936 mln
68.46%
jan 1, 2016
547.649 mln
-92.002 mln
-14.38%
Ranking of countries by current statistics by years


Comments: