29
/
en
AIzaSyAYiBZKx7MnpbEhh9jyipgxe19OcubqV5w
April 1, 2024
222316
Peru
PER
true
2
1
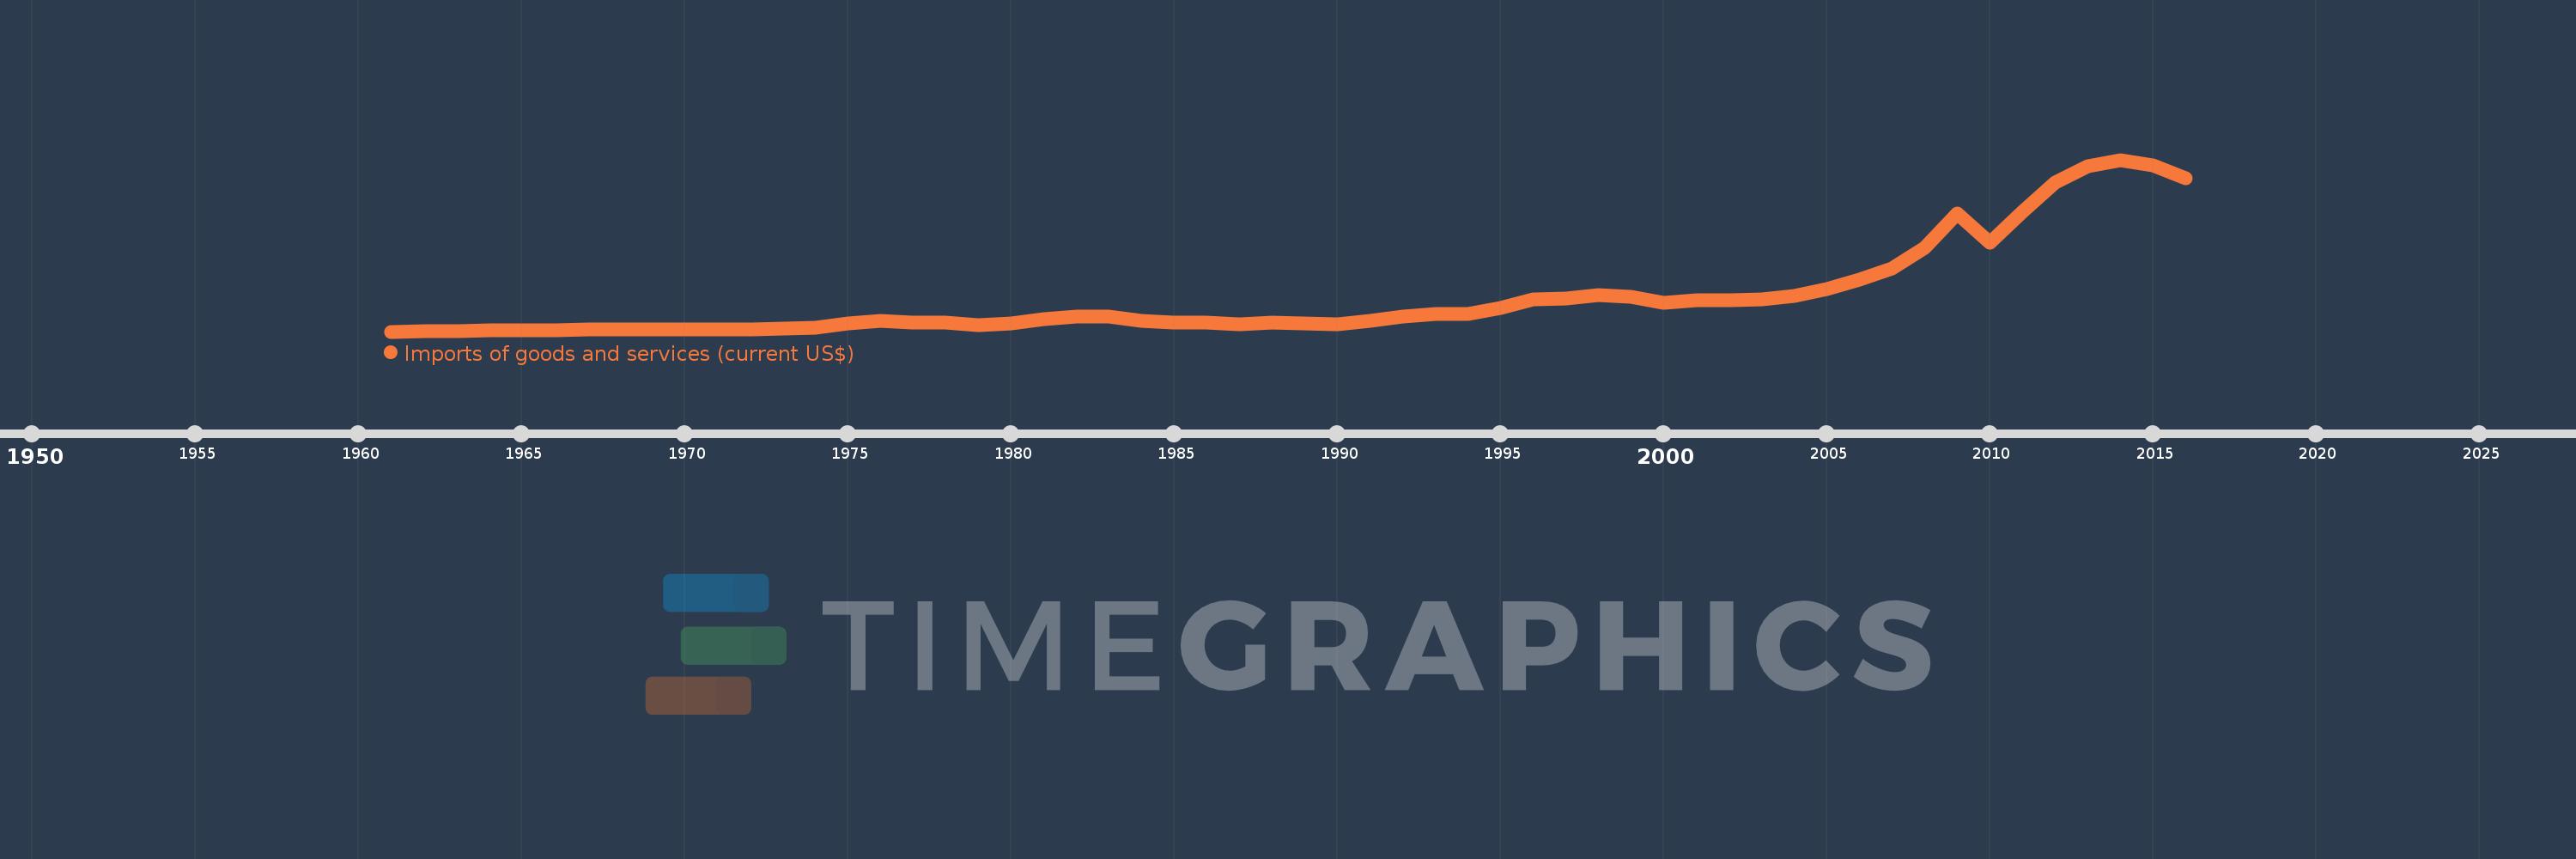
Imports of goods and services (current US$)
2016,2015,2014,2013,2012,2011,2010,2009,2008,2007,2006,2005,2004,2003,2002,2001,2000,1999,1998,1997,1996,1995,1994,1993,1992,1991,1990,1989,1988,1987,1986,1985,1984,1983,1982,1981,1980,1979,1978,1977,1976,1975,1974,1973,1972,1971,1970,1969,1968,1967,1966,1965,1964,1963,1962,1961
This statistics in other country:
AfghanistanAlbaniaAlgeriaAngolaAntigua and BarbudaArab WorldArgentinaArmeniaArubaAustraliaAustriaAzerbaijanBahamas, TheBahrainBangladeshBarbadosBelarusBelgiumBelizeBeninBermudaBhutanBoliviaBosnia and HerzegovinaBotswanaBrazilBrunei DarussalamBulgariaBurkina FasoBurundiCabo VerdeCambodiaCameroonCanadaCaribbean small statesCentral African RepublicCentral Europe and the BalticsChadChileChinaColombiaComorosCongo, Dem. Rep.Congo, Rep.Costa RicaCote d'IvoireCroatiaCubaCyprusCzech RepublicDenmarkDjiboutiDominicaDominican RepublicEarly-demographic dividendEast Asia & PacificEast Asia & Pacific (excluding high income)East Asia & Pacific (IDA & IBRD countries)EcuadorEgypt, Arab Rep.El SalvadorEquatorial GuineaEritreaEstoniaEthiopiaEuro areaEurope & Central AsiaEurope & Central Asia (excluding high income)Europe & Central Asia (IDA & IBRD countries)European UnionFaroe IslandsFijiFinlandFragile and conflict affected situationsFranceFrench PolynesiaGabonGambia, TheGeorgiaGermanyGhanaGreeceGrenadaGuatemalaGuineaGuinea-BissauGuyanaHaitiHeavily indebted poor countries (HIPC)High incomeHondurasHong Kong SAR, ChinaHungaryIBRD onlyIcelandIDA & IBRD totalIDA blendIDA onlyIDA totalIndiaIndonesiaIran, Islamic Rep.IraqIrelandIsraelItalyJamaicaJapanJordanKazakhstanKenyaKiribatiKorea, Rep.KosovoKuwaitKyrgyz RepublicLao PDRLate-demographic dividendLatin America & Caribbean Latin America & Caribbean (excluding high income)Latin America & the Caribbean (IDA & IBRD countries)LatviaLeast developed countries: UN classificationLebanonLesothoLiberiaLibyaLithuaniaLow & middle incomeLow incomeLower middle incomeLuxembourgMacao SAR, ChinaMacedonia, FYRMadagascarMalawiMalaysiaMaldivesMaliMaltaMauritaniaMauritiusMexicoMicronesia, Fed. Sts.Middle East & North AfricaMiddle East & North Africa (excluding high income)Middle East & North Africa (IDA & IBRD countries)Middle incomeMoldovaMongoliaMontenegroMoroccoMozambiqueMyanmarNamibiaNepalNetherlandsNew CaledoniaNew ZealandNicaraguaNigerNigeriaNorth AmericaNorwayOECD membersOmanOther small statesPacific island small statesPakistanPalauPanamaPapua New GuineaParaguayPeruPhilippinesPolandPortugalPost-demographic dividendPre-demographic dividendPuerto RicoQatarRomaniaRussian FederationRwandaSamoaSaudi ArabiaSenegalSerbiaSeychellesSierra LeoneSingaporeSlovak RepublicSloveniaSmall statesSolomon IslandsSomaliaSouth AfricaSouth AsiaSouth Asia (IDA & IBRD)South SudanSpainSri LankaSt. Kitts and NevisSt. LuciaSt. Vincent and the GrenadinesSub-Saharan Africa Sub-Saharan Africa (excluding high income)Sub-Saharan Africa (IDA & IBRD countries)SudanSurinameSwazilandSwedenSwitzerlandSyrian Arab RepublicTajikistanTanzaniaThailandTimor-LesteTogoTongaTrinidad and TobagoTunisiaTurkeyTurkmenistanUgandaUkraineUnited Arab EmiratesUnited KingdomUnited StatesUpper middle incomeUruguayUzbekistanVanuatuVenezuela, RBVietnamWest Bank and GazaWorldYemen, Rep.ZambiaZimbabwe Timeline:
This timeline shows a graph from 1961 to 2016 of Peru. No data until 1960. Number of actual observations by date: 56.
Source name:
World Development Indicators
Source organization:
World Bank national accounts data, and OECD National Accounts data files.
Categories, topics:
Economy & Growth, Trade
Last updated:
apr 23, 2017
Indicators value changes by year
Minimum:
521.341 mln
jan 1, 1961
Maximum:
50.235 bln
jan 1, 2014
At the date of observation
Value
Absolute change
Change from previous value
jan 1, 1961
521.341 mln
+521.341 mln
0.0%
jan 1, 1962
643.728 mln
+122.387 mln
23.48%
jan 1, 1963
721.773 mln
+78.045 mln
12.12%
jan 1, 1964
777.062 mln
+55.289 mln
7.66%
jan 1, 1965
819.078 mln
+42.015 mln
5.41%
jan 1, 1966
981.343 mln
+162.265 mln
19.81%
jan 1, 1967
1.172 bln
+190.299 mln
19.39%
jan 1, 1968
1.252 bln
+80.014 mln
6.83%
jan 1, 1969
1.083 bln
-168.968 mln
-13.5%
jan 1, 1970
1.08 bln
-2.584 mln
-0.24%
jan 1, 1971
1.158 bln
+77.519 mln
7.18%
jan 1, 1972
1.225 bln
+67.184 mln
5.8%
jan 1, 1973
1.323 bln
+98.191 mln
8.02%
jan 1, 1974
1.687 bln
+364.341 mln
27.54%
jan 1, 1975
2.959 bln
+1.271 bln
75.34%
jan 1, 1976
3.605 bln
+646.282 mln
21.84%
jan 1, 1977
3.14 bln
-464.867 mln
-12.9%
jan 1, 1978
3.234 bln
+93.819 mln
2.99%
jan 1, 1979
2.44 bln
-793.711 mln
-24.54%
jan 1, 1980
2.966 bln
+525.983 mln
21.56%
jan 1, 1981
4.012 bln
+1.046 bln
35.25%
jan 1, 1982
4.918 bln
+906.536 mln
22.6%
jan 1, 1983
4.849 bln
-68.821 mln
-1.4%
jan 1, 1984
3.73 bln
-1.12 bln
-23.09%
jan 1, 1985
3.058 bln
-671.897 mln
-18.02%
jan 1, 1986
3.1 bln
+42.513 mln
1.39%
jan 1, 1987
2.755 bln
-345.0 mln
-11.13%
jan 1, 1988
3.04 bln
+285.033 mln
10.35%
jan 1, 1989
2.798 bln
-242.257 mln
-7.97%
jan 1, 1990
2.522 bln
-276.422 mln
-9.88%
jan 1, 1991
3.637 bln
+1.116 bln
44.25%
jan 1, 1992
4.965 bln
+1.327 bln
36.49%
jan 1, 1993
5.562 bln
+597.052 mln
12.03%
jan 1, 1994
5.683 bln
+121.419 mln
2.18%
jan 1, 1995
7.249 bln
+1.566 bln
27.55%
jan 1, 1996
9.771 bln
+2.522 bln
34.79%
jan 1, 1997
10.132 bln
+361.2 mln
3.7%
jan 1, 1998
11.044 bln
+911.53 mln
9.0%
jan 1, 1999
10.684 bln
-359.444 mln
-3.25%
jan 1, 2000
8.938 bln
-1.746 bln
-16.34%
jan 1, 2001
9.712 bln
+774.508 mln
8.67%
jan 1, 2002
9.606 bln
-105.973 mln
-1.09%
jan 1, 2003
9.846 bln
+239.582 mln
2.49%
jan 1, 2004
10.93 bln
+1.084 bln
11.01%
jan 1, 2005
12.702 bln
+1.772 bln
16.21%
jan 1, 2006
15.599 bln
+2.897 bln
22.81%
jan 1, 2007
18.835 bln
+3.236 bln
20.75%
jan 1, 2008
24.691 bln
+5.855 bln
31.09%
jan 1, 2009
34.605 bln
+9.915 bln
40.16%
jan 1, 2010
26.182 bln
-8.423 bln
-24.34%
jan 1, 2011
35.172 bln
+8.99 bln
34.34%
jan 1, 2012
43.765 bln
+8.593 bln
24.43%
jan 1, 2013
48.479 bln
+4.714 bln
10.77%
jan 1, 2014
50.235 bln
+1.755 bln
3.62%
jan 1, 2015
48.677 bln
-1.558 bln
-3.1%
jan 1, 2016
44.839 bln
-3.838 bln
-7.88%
Ranking of countries by current statistics by years


Comments: