29
/
en
AIzaSyAYiBZKx7MnpbEhh9jyipgxe19OcubqV5w
April 1, 2024
86073
Bhutan
BTN
true
2
1
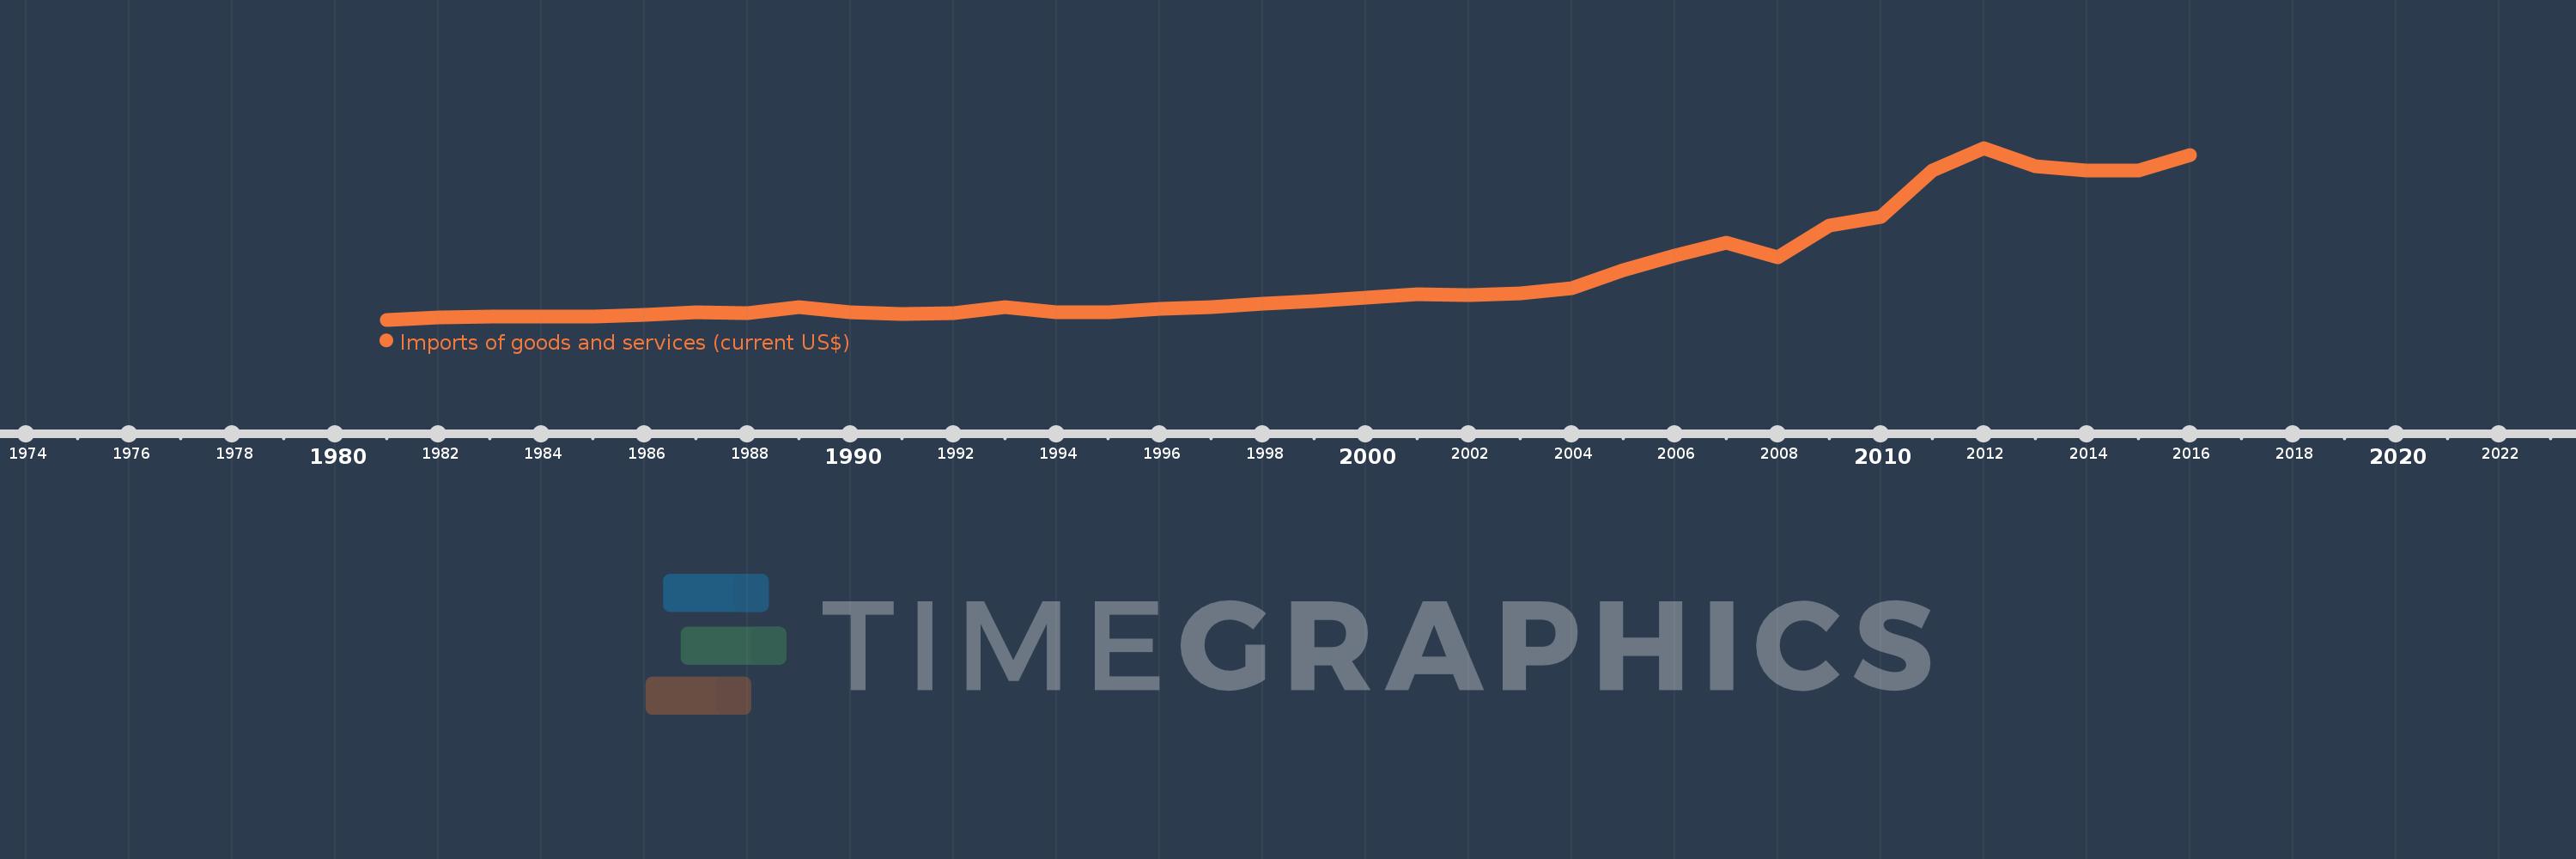
Imports of goods and services (current US$)
2016,2015,2014,2013,2012,2011,2010,2009,2008,2007,2006,2005,2004,2003,2002,2001,2000,1999,1998,1997,1996,1995,1994,1993,1992,1991,1990,1989,1988,1987,1986,1985,1984,1983,1982,1981
This statistics in other country:
AfghanistanAlbaniaAlgeriaAngolaAntigua and BarbudaArab WorldArgentinaArmeniaArubaAustraliaAustriaAzerbaijanBahamas, TheBahrainBangladeshBarbadosBelarusBelgiumBelizeBeninBermudaBhutanBoliviaBosnia and HerzegovinaBotswanaBrazilBrunei DarussalamBulgariaBurkina FasoBurundiCabo VerdeCambodiaCameroonCanadaCaribbean small statesCentral African RepublicCentral Europe and the BalticsChadChileChinaColombiaComorosCongo, Dem. Rep.Congo, Rep.Costa RicaCote d'IvoireCroatiaCubaCyprusCzech RepublicDenmarkDjiboutiDominicaDominican RepublicEarly-demographic dividendEast Asia & PacificEast Asia & Pacific (excluding high income)East Asia & Pacific (IDA & IBRD countries)EcuadorEgypt, Arab Rep.El SalvadorEquatorial GuineaEritreaEstoniaEthiopiaEuro areaEurope & Central AsiaEurope & Central Asia (excluding high income)Europe & Central Asia (IDA & IBRD countries)European UnionFaroe IslandsFijiFinlandFragile and conflict affected situationsFranceFrench PolynesiaGabonGambia, TheGeorgiaGermanyGhanaGreeceGrenadaGuatemalaGuineaGuinea-BissauGuyanaHaitiHeavily indebted poor countries (HIPC)High incomeHondurasHong Kong SAR, ChinaHungaryIBRD onlyIcelandIDA & IBRD totalIDA blendIDA onlyIDA totalIndiaIndonesiaIran, Islamic Rep.IraqIrelandIsraelItalyJamaicaJapanJordanKazakhstanKenyaKiribatiKorea, Rep.KosovoKuwaitKyrgyz RepublicLao PDRLate-demographic dividendLatin America & Caribbean Latin America & Caribbean (excluding high income)Latin America & the Caribbean (IDA & IBRD countries)LatviaLeast developed countries: UN classificationLebanonLesothoLiberiaLibyaLithuaniaLow & middle incomeLow incomeLower middle incomeLuxembourgMacao SAR, ChinaMacedonia, FYRMadagascarMalawiMalaysiaMaldivesMaliMaltaMauritaniaMauritiusMexicoMicronesia, Fed. Sts.Middle East & North AfricaMiddle East & North Africa (excluding high income)Middle East & North Africa (IDA & IBRD countries)Middle incomeMoldovaMongoliaMontenegroMoroccoMozambiqueMyanmarNamibiaNepalNetherlandsNew CaledoniaNew ZealandNicaraguaNigerNigeriaNorth AmericaNorwayOECD membersOmanOther small statesPacific island small statesPakistanPalauPanamaPapua New GuineaParaguayPeruPhilippinesPolandPortugalPost-demographic dividendPre-demographic dividendPuerto RicoQatarRomaniaRussian FederationRwandaSamoaSaudi ArabiaSenegalSerbiaSeychellesSierra LeoneSingaporeSlovak RepublicSloveniaSmall statesSolomon IslandsSomaliaSouth AfricaSouth AsiaSouth Asia (IDA & IBRD)South SudanSpainSri LankaSt. Kitts and NevisSt. LuciaSt. Vincent and the GrenadinesSub-Saharan Africa Sub-Saharan Africa (excluding high income)Sub-Saharan Africa (IDA & IBRD countries)SudanSurinameSwazilandSwedenSwitzerlandSyrian Arab RepublicTajikistanTanzaniaThailandTimor-LesteTogoTongaTrinidad and TobagoTunisiaTurkeyTurkmenistanUgandaUkraineUnited Arab EmiratesUnited KingdomUnited StatesUpper middle incomeUruguayUzbekistanVanuatuVenezuela, RBVietnamWest Bank and GazaWorldYemen, Rep.ZambiaZimbabwe Timeline:
This timeline shows a graph from 1981 to 2016 of Bhutan. No data until 1980. Number of actual observations by date: 36.
Source name:
World Development Indicators
Source organization:
World Bank national accounts data, and OECD National Accounts data files.
Categories, topics:
Economy & Growth, Trade
Last updated:
apr 23, 2017
Indicators value changes by year
Minimum:
51.145 mln
jan 1, 1981
Maximum:
1.283 bln
jan 1, 2012
At the date of observation
Value
Absolute change
Change from previous value
jan 1, 1981
51.145 mln
+51.145 mln
0.0%
jan 1, 1982
70.324 mln
+19.179 mln
37.5%
jan 1, 1983
71.036 mln
+711.46K
1.01%
jan 1, 1984
75.792 mln
+4.756 mln
6.7%
jan 1, 1985
76.39 mln
+597.886K
0.79%
jan 1, 1986
88.068 mln
+11.678 mln
15.29%
jan 1, 1987
105.564 mln
+17.496 mln
19.87%
jan 1, 1988
96.441 mln
-9.123 mln
-8.64%
jan 1, 1989
139.42 mln
+42.979 mln
44.57%
jan 1, 1990
104.771 mln
-34.648 mln
-24.85%
jan 1, 1991
91.893 mln
-12.879 mln
-12.29%
jan 1, 1992
100.325 mln
+8.433 mln
9.18%
jan 1, 1993
140.204 mln
+39.878 mln
39.75%
jan 1, 1994
103.726 mln
-36.478 mln
-26.02%
jan 1, 1995
106.766 mln
+3.041 mln
2.93%
jan 1, 1996
129.19 mln
+22.424 mln
21.0%
jan 1, 1997
144.504 mln
+15.314 mln
11.85%
jan 1, 1998
168.768 mln
+24.264 mln
16.79%
jan 1, 1999
186.282 mln
+17.514 mln
10.38%
jan 1, 2000
212.456 mln
+26.174 mln
14.05%
jan 1, 2001
234.884 mln
+22.427 mln
10.56%
jan 1, 2002
225.087 mln
-9.797 mln
-4.17%
jan 1, 2003
239.736 mln
+14.649 mln
6.51%
jan 1, 2004
274.714 mln
+34.978 mln
14.59%
jan 1, 2005
406.162 mln
+131.447 mln
47.85%
jan 1, 2006
513.878 mln
+107.716 mln
26.52%
jan 1, 2007
601.673 mln
+87.795 mln
17.08%
jan 1, 2008
497.638 mln
-104.035 mln
-17.29%
jan 1, 2009
729.319 mln
+231.681 mln
46.56%
jan 1, 2010
786.732 mln
+57.413 mln
7.87%
jan 1, 2011
1.121 bln
+334.692 mln
42.54%
jan 1, 2012
1.283 bln
+161.571 mln
14.41%
jan 1, 2013
1.15 bln
-133.365 mln
-10.39%
jan 1, 2014
1.12 bln
-29.707 mln
-2.58%
jan 1, 2015
1.123 bln
+3.225 mln
0.29%
jan 1, 2016
1.234 bln
+111.061 mln
9.89%
Ranking of countries by current statistics by years


Comments: