29
/
en
AIzaSyAYiBZKx7MnpbEhh9jyipgxe19OcubqV5w
April 1, 2024
133265
Finland
FIN
true
2
1
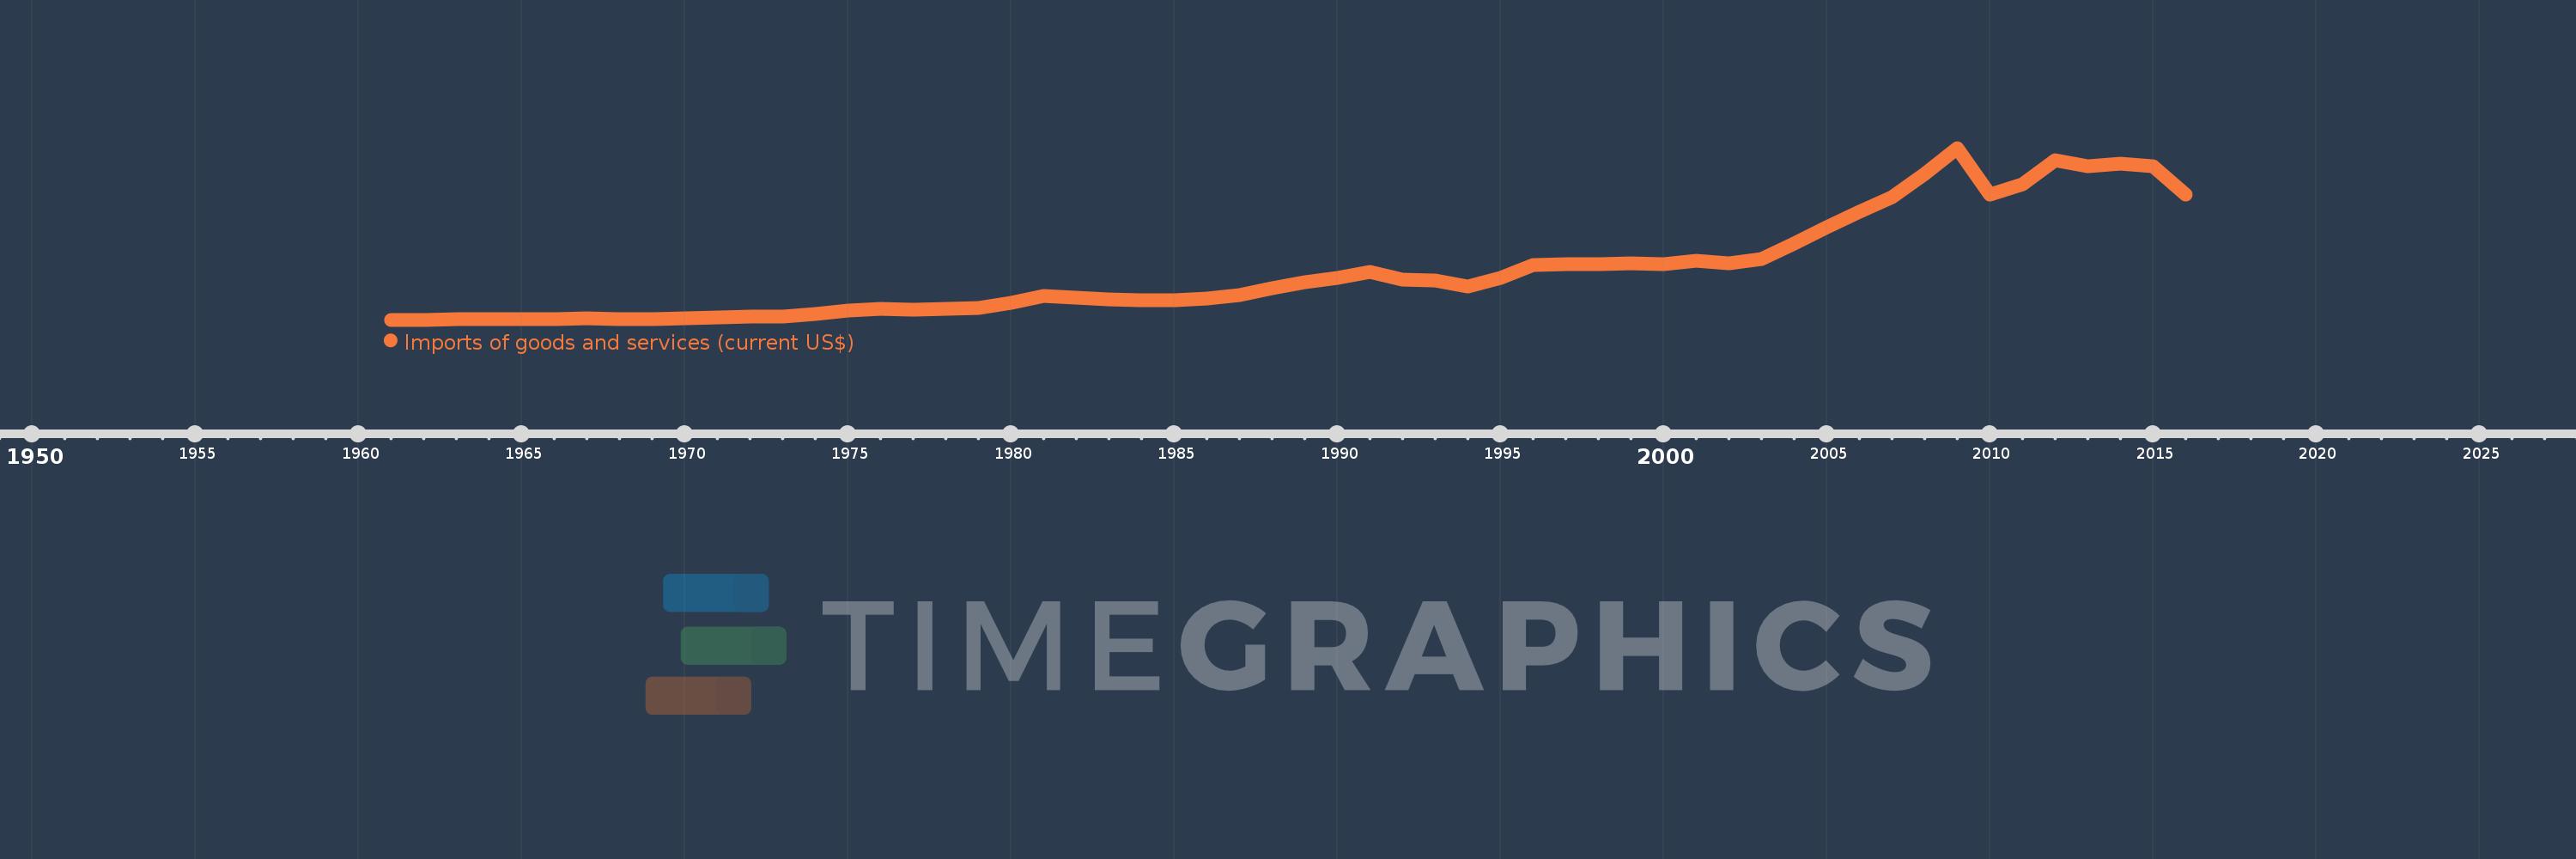
Imports of goods and services (current US$)
2016,2015,2014,2013,2012,2011,2010,2009,2008,2007,2006,2005,2004,2003,2002,2001,2000,1999,1998,1997,1996,1995,1994,1993,1992,1991,1990,1989,1988,1987,1986,1985,1984,1983,1982,1981,1980,1979,1978,1977,1976,1975,1974,1973,1972,1971,1970,1969,1968,1967,1966,1965,1964,1963,1962,1961
This statistics in other country:
AfghanistanAlbaniaAlgeriaAngolaAntigua and BarbudaArab WorldArgentinaArmeniaArubaAustraliaAustriaAzerbaijanBahamas, TheBahrainBangladeshBarbadosBelarusBelgiumBelizeBeninBermudaBhutanBoliviaBosnia and HerzegovinaBotswanaBrazilBrunei DarussalamBulgariaBurkina FasoBurundiCabo VerdeCambodiaCameroonCanadaCaribbean small statesCentral African RepublicCentral Europe and the BalticsChadChileChinaColombiaComorosCongo, Dem. Rep.Congo, Rep.Costa RicaCote d'IvoireCroatiaCubaCyprusCzech RepublicDenmarkDjiboutiDominicaDominican RepublicEarly-demographic dividendEast Asia & PacificEast Asia & Pacific (excluding high income)East Asia & Pacific (IDA & IBRD countries)EcuadorEgypt, Arab Rep.El SalvadorEquatorial GuineaEritreaEstoniaEthiopiaEuro areaEurope & Central AsiaEurope & Central Asia (excluding high income)Europe & Central Asia (IDA & IBRD countries)European UnionFaroe IslandsFijiFinlandFragile and conflict affected situationsFranceFrench PolynesiaGabonGambia, TheGeorgiaGermanyGhanaGreeceGrenadaGuatemalaGuineaGuinea-BissauGuyanaHaitiHeavily indebted poor countries (HIPC)High incomeHondurasHong Kong SAR, ChinaHungaryIBRD onlyIcelandIDA & IBRD totalIDA blendIDA onlyIDA totalIndiaIndonesiaIran, Islamic Rep.IraqIrelandIsraelItalyJamaicaJapanJordanKazakhstanKenyaKiribatiKorea, Rep.KosovoKuwaitKyrgyz RepublicLao PDRLate-demographic dividendLatin America & Caribbean Latin America & Caribbean (excluding high income)Latin America & the Caribbean (IDA & IBRD countries)LatviaLeast developed countries: UN classificationLebanonLesothoLiberiaLibyaLithuaniaLow & middle incomeLow incomeLower middle incomeLuxembourgMacao SAR, ChinaMacedonia, FYRMadagascarMalawiMalaysiaMaldivesMaliMaltaMauritaniaMauritiusMexicoMicronesia, Fed. Sts.Middle East & North AfricaMiddle East & North Africa (excluding high income)Middle East & North Africa (IDA & IBRD countries)Middle incomeMoldovaMongoliaMontenegroMoroccoMozambiqueMyanmarNamibiaNepalNetherlandsNew CaledoniaNew ZealandNicaraguaNigerNigeriaNorth AmericaNorwayOECD membersOmanOther small statesPacific island small statesPakistanPalauPanamaPapua New GuineaParaguayPeruPhilippinesPolandPortugalPost-demographic dividendPre-demographic dividendPuerto RicoQatarRomaniaRussian FederationRwandaSamoaSaudi ArabiaSenegalSerbiaSeychellesSierra LeoneSingaporeSlovak RepublicSloveniaSmall statesSolomon IslandsSomaliaSouth AfricaSouth AsiaSouth Asia (IDA & IBRD)South SudanSpainSri LankaSt. Kitts and NevisSt. LuciaSt. Vincent and the GrenadinesSub-Saharan Africa Sub-Saharan Africa (excluding high income)Sub-Saharan Africa (IDA & IBRD countries)SudanSurinameSwazilandSwedenSwitzerlandSyrian Arab RepublicTajikistanTanzaniaThailandTimor-LesteTogoTongaTrinidad and TobagoTunisiaTurkeyTurkmenistanUgandaUkraineUnited Arab EmiratesUnited KingdomUnited StatesUpper middle incomeUruguayUzbekistanVanuatuVenezuela, RBVietnamWest Bank and GazaWorldYemen, Rep.ZambiaZimbabwe Timeline:
This timeline shows a graph from 1961 to 2016 of Finland. No data until 1960. Number of actual observations by date: 56.
Source name:
World Development Indicators
Source organization:
World Bank national accounts data, and OECD National Accounts data files.
Categories, topics:
Economy & Growth, Trade
Last updated:
apr 23, 2017
Indicators value changes by year
Minimum:
1.162 bln
jan 1, 1961
Maximum:
117.566 bln
jan 1, 2009
At the date of observation
Value
Absolute change
Change from previous value
jan 1, 1961
1.162 bln
+1.162 bln
0.0%
jan 1, 1962
1.266 bln
+104.275 mln
8.97%
jan 1, 1963
1.359 bln
+93.136 mln
7.36%
jan 1, 1964
1.336 bln
-22.897 mln
-1.68%
jan 1, 1965
1.646 bln
+310.041 mln
23.2%
jan 1, 1966
1.808 bln
+161.209 mln
9.79%
jan 1, 1967
1.9 bln
+92.206 mln
5.1%
jan 1, 1968
1.854 bln
-45.825 mln
-2.41%
jan 1, 1969
1.785 bln
-68.913 mln
-3.72%
jan 1, 1970
2.244 bln
+458.537 mln
25.69%
jan 1, 1971
2.902 bln
+658.346 mln
29.34%
jan 1, 1972
3.116 bln
+214.116 mln
7.38%
jan 1, 1973
3.559 bln
+442.481 mln
14.2%
jan 1, 1974
4.849 bln
+1.291 bln
36.27%
jan 1, 1975
7.339 bln
+2.49 bln
51.34%
jan 1, 1976
8.311 bln
+972.121 mln
13.25%
jan 1, 1977
8.192 bln
-118.945 mln
-1.43%
jan 1, 1978
8.555 bln
+363.378 mln
4.44%
jan 1, 1979
8.979 bln
+423.653 mln
4.95%
jan 1, 1980
12.688 bln
+3.709 bln
41.31%
jan 1, 1981
17.233 bln
+4.545 bln
35.82%
jan 1, 1982
15.897 bln
-1.336 bln
-7.75%
jan 1, 1983
15.154 bln
-743.37 mln
-4.68%
jan 1, 1984
14.637 bln
-516.509 mln
-3.41%
jan 1, 1985
14.34 bln
-296.936 mln
-2.03%
jan 1, 1986
15.265 bln
+924.647 mln
6.45%
jan 1, 1987
17.895 bln
+2.63 bln
17.23%
jan 1, 1988
22.423 bln
+4.528 bln
25.3%
jan 1, 1989
26.449 bln
+4.027 bln
17.96%
jan 1, 1990
29.576 bln
+3.127 bln
11.82%
jan 1, 1991
33.514 bln
+3.938 bln
13.32%
jan 1, 1992
28.39 bln
-5.124 bln
-15.29%
jan 1, 1993
27.793 bln
-597.269 mln
-2.1%
jan 1, 1994
23.895 bln
-3.898 bln
-14.02%
jan 1, 1995
29.33 bln
+5.434 bln
22.74%
jan 1, 1996
37.987 bln
+8.658 bln
29.52%
jan 1, 1997
38.849 bln
+861.867 mln
2.27%
jan 1, 1998
38.637 bln
-212.299 mln
-0.55%
jan 1, 1999
39.579 bln
+942.399 mln
2.44%
jan 1, 2000
38.72 bln
-859.005 mln
-2.17%
jan 1, 2001
41.312 bln
+2.592 bln
6.69%
jan 1, 2002
39.49 bln
-1.822 bln
-4.41%
jan 1, 2003
42.151 bln
+2.661 bln
6.74%
jan 1, 2004
52.641 bln
+10.49 bln
24.89%
jan 1, 2005
63.757 bln
+11.116 bln
21.12%
jan 1, 2006
74.358 bln
+10.601 bln
16.63%
jan 1, 2007
84.481 bln
+10.124 bln
13.61%
jan 1, 2008
100.057 bln
+15.576 bln
18.44%
jan 1, 2009
117.566 bln
+17.508 bln
17.5%
jan 1, 2010
86.164 bln
-31.401 bln
-26.71%
jan 1, 2011
92.713 bln
+6.548 bln
7.6%
jan 1, 2012
109.491 bln
+16.779 bln
18.1%
jan 1, 2013
105.055 bln
-4.436 bln
-4.05%
jan 1, 2014
107.181 bln
+2.125 bln
2.02%
jan 1, 2015
105.218 bln
-1.963 bln
-1.83%
jan 1, 2016
86.002 bln
-19.216 bln
-18.26%
Ranking of countries by current statistics by years


Comments: