29
/
en
AIzaSyAYiBZKx7MnpbEhh9jyipgxe19OcubqV5w
April 1, 2024
39081
IDA only
IDX
false
2
1
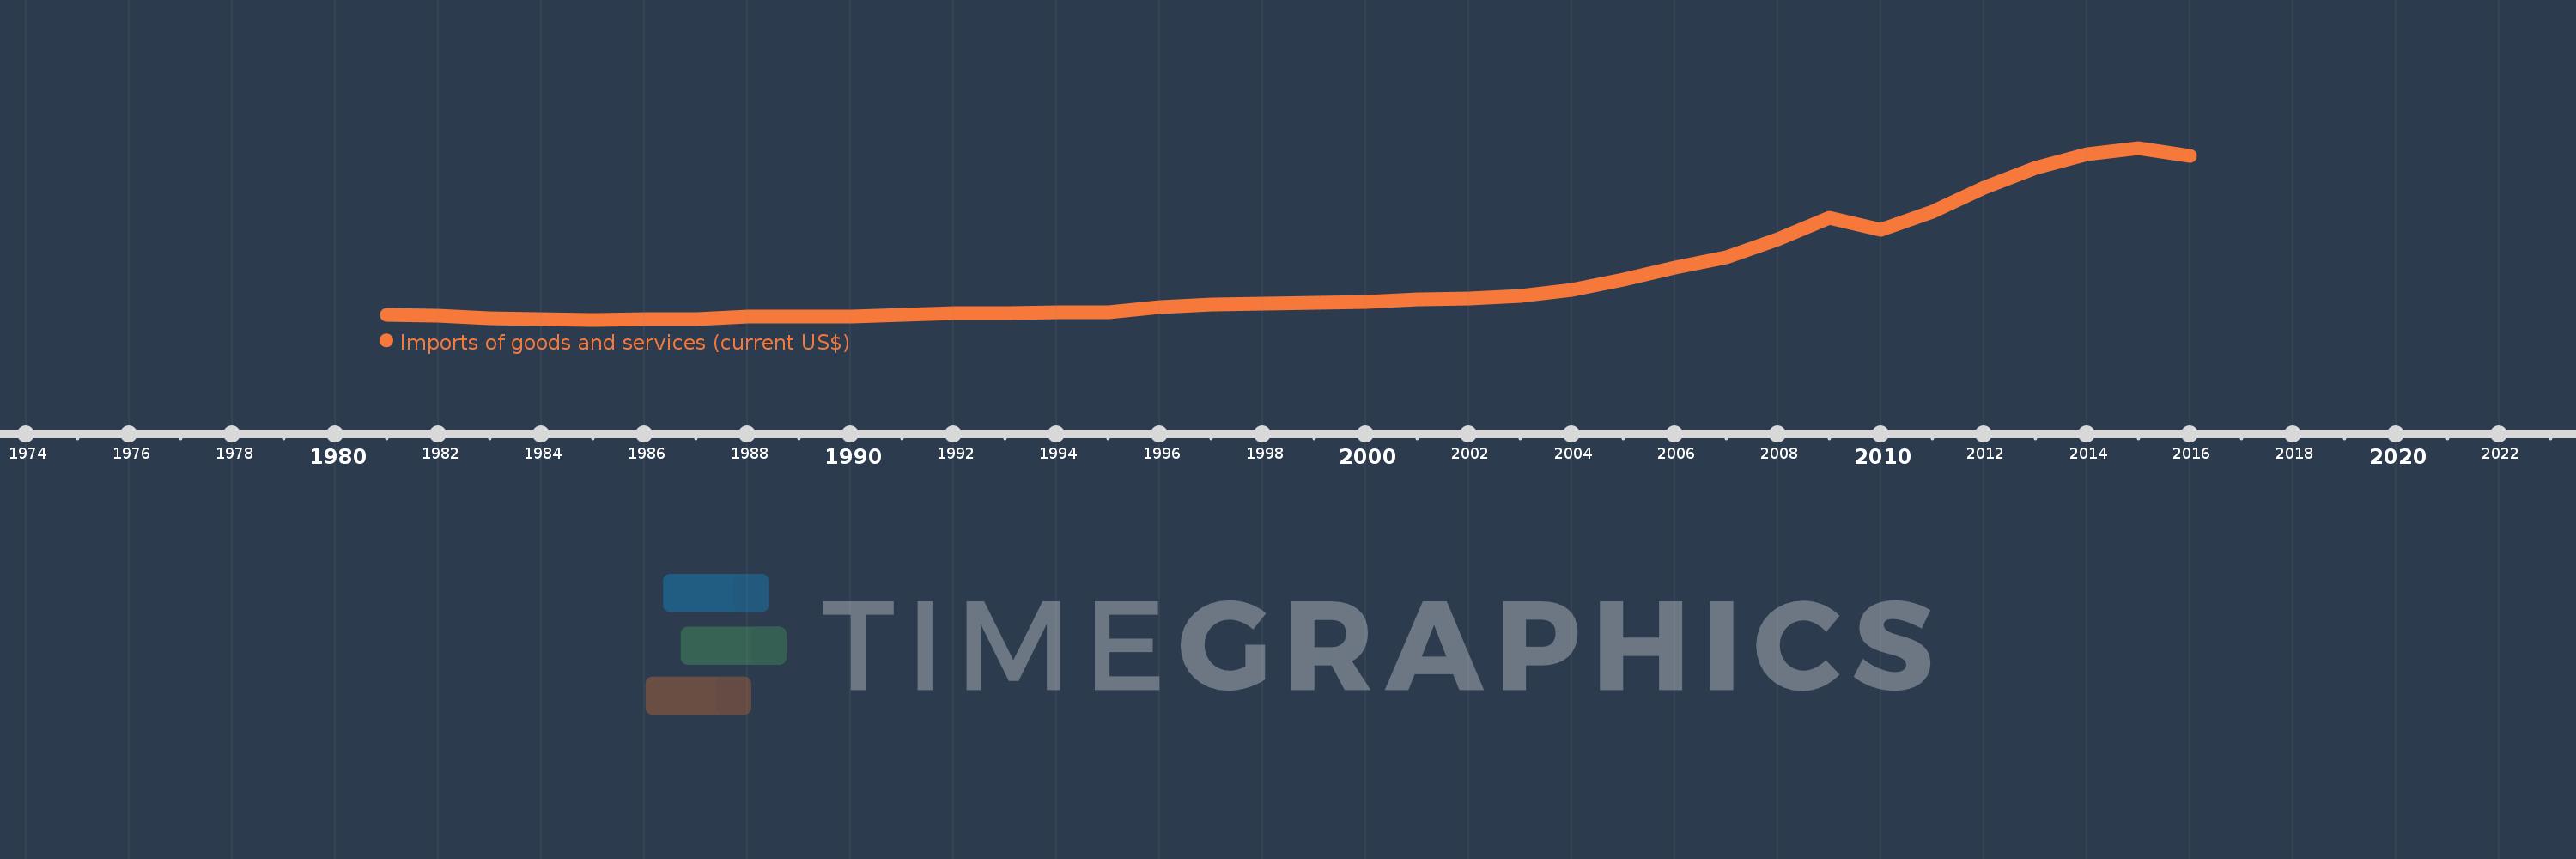
Imports of goods and services (current US$)
2016,2015,2014,2013,2012,2011,2010,2009,2008,2007,2006,2005,2004,2003,2002,2001,2000,1999,1998,1997,1996,1995,1994,1993,1992,1991,1990,1989,1988,1987,1986,1985,1984,1983,1982,1981
This statistics in other country:
AfghanistanAlbaniaAlgeriaAngolaAntigua and BarbudaArab WorldArgentinaArmeniaArubaAustraliaAustriaAzerbaijanBahamas, TheBahrainBangladeshBarbadosBelarusBelgiumBelizeBeninBermudaBhutanBoliviaBosnia and HerzegovinaBotswanaBrazilBrunei DarussalamBulgariaBurkina FasoBurundiCabo VerdeCambodiaCameroonCanadaCaribbean small statesCentral African RepublicCentral Europe and the BalticsChadChileChinaColombiaComorosCongo, Dem. Rep.Congo, Rep.Costa RicaCote d'IvoireCroatiaCubaCyprusCzech RepublicDenmarkDjiboutiDominicaDominican RepublicEarly-demographic dividendEast Asia & PacificEast Asia & Pacific (excluding high income)East Asia & Pacific (IDA & IBRD countries)EcuadorEgypt, Arab Rep.El SalvadorEquatorial GuineaEritreaEstoniaEthiopiaEuro areaEurope & Central AsiaEurope & Central Asia (excluding high income)Europe & Central Asia (IDA & IBRD countries)European UnionFaroe IslandsFijiFinlandFragile and conflict affected situationsFranceFrench PolynesiaGabonGambia, TheGeorgiaGermanyGhanaGreeceGrenadaGuatemalaGuineaGuinea-BissauGuyanaHaitiHeavily indebted poor countries (HIPC)High incomeHondurasHong Kong SAR, ChinaHungaryIBRD onlyIcelandIDA & IBRD totalIDA blendIDA onlyIDA totalIndiaIndonesiaIran, Islamic Rep.IraqIrelandIsraelItalyJamaicaJapanJordanKazakhstanKenyaKiribatiKorea, Rep.KosovoKuwaitKyrgyz RepublicLao PDRLate-demographic dividendLatin America & Caribbean Latin America & Caribbean (excluding high income)Latin America & the Caribbean (IDA & IBRD countries)LatviaLeast developed countries: UN classificationLebanonLesothoLiberiaLibyaLithuaniaLow & middle incomeLow incomeLower middle incomeLuxembourgMacao SAR, ChinaMacedonia, FYRMadagascarMalawiMalaysiaMaldivesMaliMaltaMauritaniaMauritiusMexicoMicronesia, Fed. Sts.Middle East & North AfricaMiddle East & North Africa (excluding high income)Middle East & North Africa (IDA & IBRD countries)Middle incomeMoldovaMongoliaMontenegroMoroccoMozambiqueMyanmarNamibiaNepalNetherlandsNew CaledoniaNew ZealandNicaraguaNigerNigeriaNorth AmericaNorwayOECD membersOmanOther small statesPacific island small statesPakistanPalauPanamaPapua New GuineaParaguayPeruPhilippinesPolandPortugalPost-demographic dividendPre-demographic dividendPuerto RicoQatarRomaniaRussian FederationRwandaSamoaSaudi ArabiaSenegalSerbiaSeychellesSierra LeoneSingaporeSlovak RepublicSloveniaSmall statesSolomon IslandsSomaliaSouth AfricaSouth AsiaSouth Asia (IDA & IBRD)South SudanSpainSri LankaSt. Kitts and NevisSt. LuciaSt. Vincent and the GrenadinesSub-Saharan Africa Sub-Saharan Africa (excluding high income)Sub-Saharan Africa (IDA & IBRD countries)SudanSurinameSwazilandSwedenSwitzerlandSyrian Arab RepublicTajikistanTanzaniaThailandTimor-LesteTogoTongaTrinidad and TobagoTunisiaTurkeyTurkmenistanUgandaUkraineUnited Arab EmiratesUnited KingdomUnited StatesUpper middle incomeUruguayUzbekistanVanuatuVenezuela, RBVietnamWest Bank and GazaWorldYemen, Rep.ZambiaZimbabwe Timeline:
This timeline shows a graph from 1981 to 2016 of IDA only. No data until 1980. Number of actual observations by date: 36.
Source name:
World Development Indicators
Source organization:
World Bank national accounts data, and OECD National Accounts data files.
Categories, topics:
Economy & Growth, Trade
Last updated:
apr 23, 2017
Indicators value changes by year
Minimum:
35.076 bln
jan 1, 1985
Maximum:
391.092 bln
jan 1, 2015
At the date of observation
Value
Absolute change
Change from previous value
jan 1, 1981
45.231 bln
+45.231 bln
0.0%
jan 1, 1982
43.742 bln
-1.489 bln
-3.29%
jan 1, 1983
38.587 bln
-5.155 bln
-11.79%
jan 1, 1984
36.196 bln
-2.391 bln
-6.2%
jan 1, 1985
35.076 bln
-1.121 bln
-3.1%
jan 1, 1986
35.774 bln
+698.213 mln
1.99%
jan 1, 1987
36.364 bln
+589.667 mln
1.65%
jan 1, 1988
41.336 bln
+4.973 bln
13.68%
jan 1, 1989
42.384 bln
+1.048 bln
2.54%
jan 1, 1990
42.183 bln
-201.284 mln
-0.47%
jan 1, 1991
45.682 bln
+3.499 bln
8.3%
jan 1, 1992
47.95 bln
+2.267 bln
4.96%
jan 1, 1993
48.997 bln
+1.047 bln
2.18%
jan 1, 1994
50.693 bln
+1.696 bln
3.46%
jan 1, 1995
50.142 bln
-550.191 mln
-1.09%
jan 1, 1996
60.581 bln
+10.439 bln
20.82%
jan 1, 1997
66.928 bln
+6.346 bln
10.48%
jan 1, 1998
68.146 bln
+1.219 bln
1.82%
jan 1, 1999
70.463 bln
+2.317 bln
3.4%
jan 1, 2000
71.765 bln
+1.302 bln
1.85%
jan 1, 2001
77.406 bln
+5.641 bln
7.86%
jan 1, 2002
79.1 bln
+1.693 bln
2.19%
jan 1, 2003
83.862 bln
+4.762 bln
6.02%
jan 1, 2004
96.922 bln
+13.06 bln
15.57%
jan 1, 2005
118.571 bln
+21.649 bln
22.34%
jan 1, 2006
142.775 bln
+24.205 bln
20.41%
jan 1, 2007
165.035 bln
+22.26 bln
15.59%
jan 1, 2008
202.188 bln
+37.154 bln
22.51%
jan 1, 2009
245.998 bln
+43.809 bln
21.67%
jan 1, 2010
222.325 bln
-23.673 bln
-9.62%
jan 1, 2011
259.377 bln
+37.052 bln
16.67%
jan 1, 2012
309.356 bln
+49.979 bln
19.27%
jan 1, 2013
349.495 bln
+40.139 bln
12.98%
jan 1, 2014
377.778 bln
+28.283 bln
8.09%
jan 1, 2015
391.092 bln
+13.314 bln
3.52%
jan 1, 2016
374.498 bln
-16.594 bln
-4.24%
Ranking of countries by current statistics by years


Comments: