29
/
en
AIzaSyAYiBZKx7MnpbEhh9jyipgxe19OcubqV5w
April 1, 2024
281106
Venezuela, RB
VEN
true
2
1
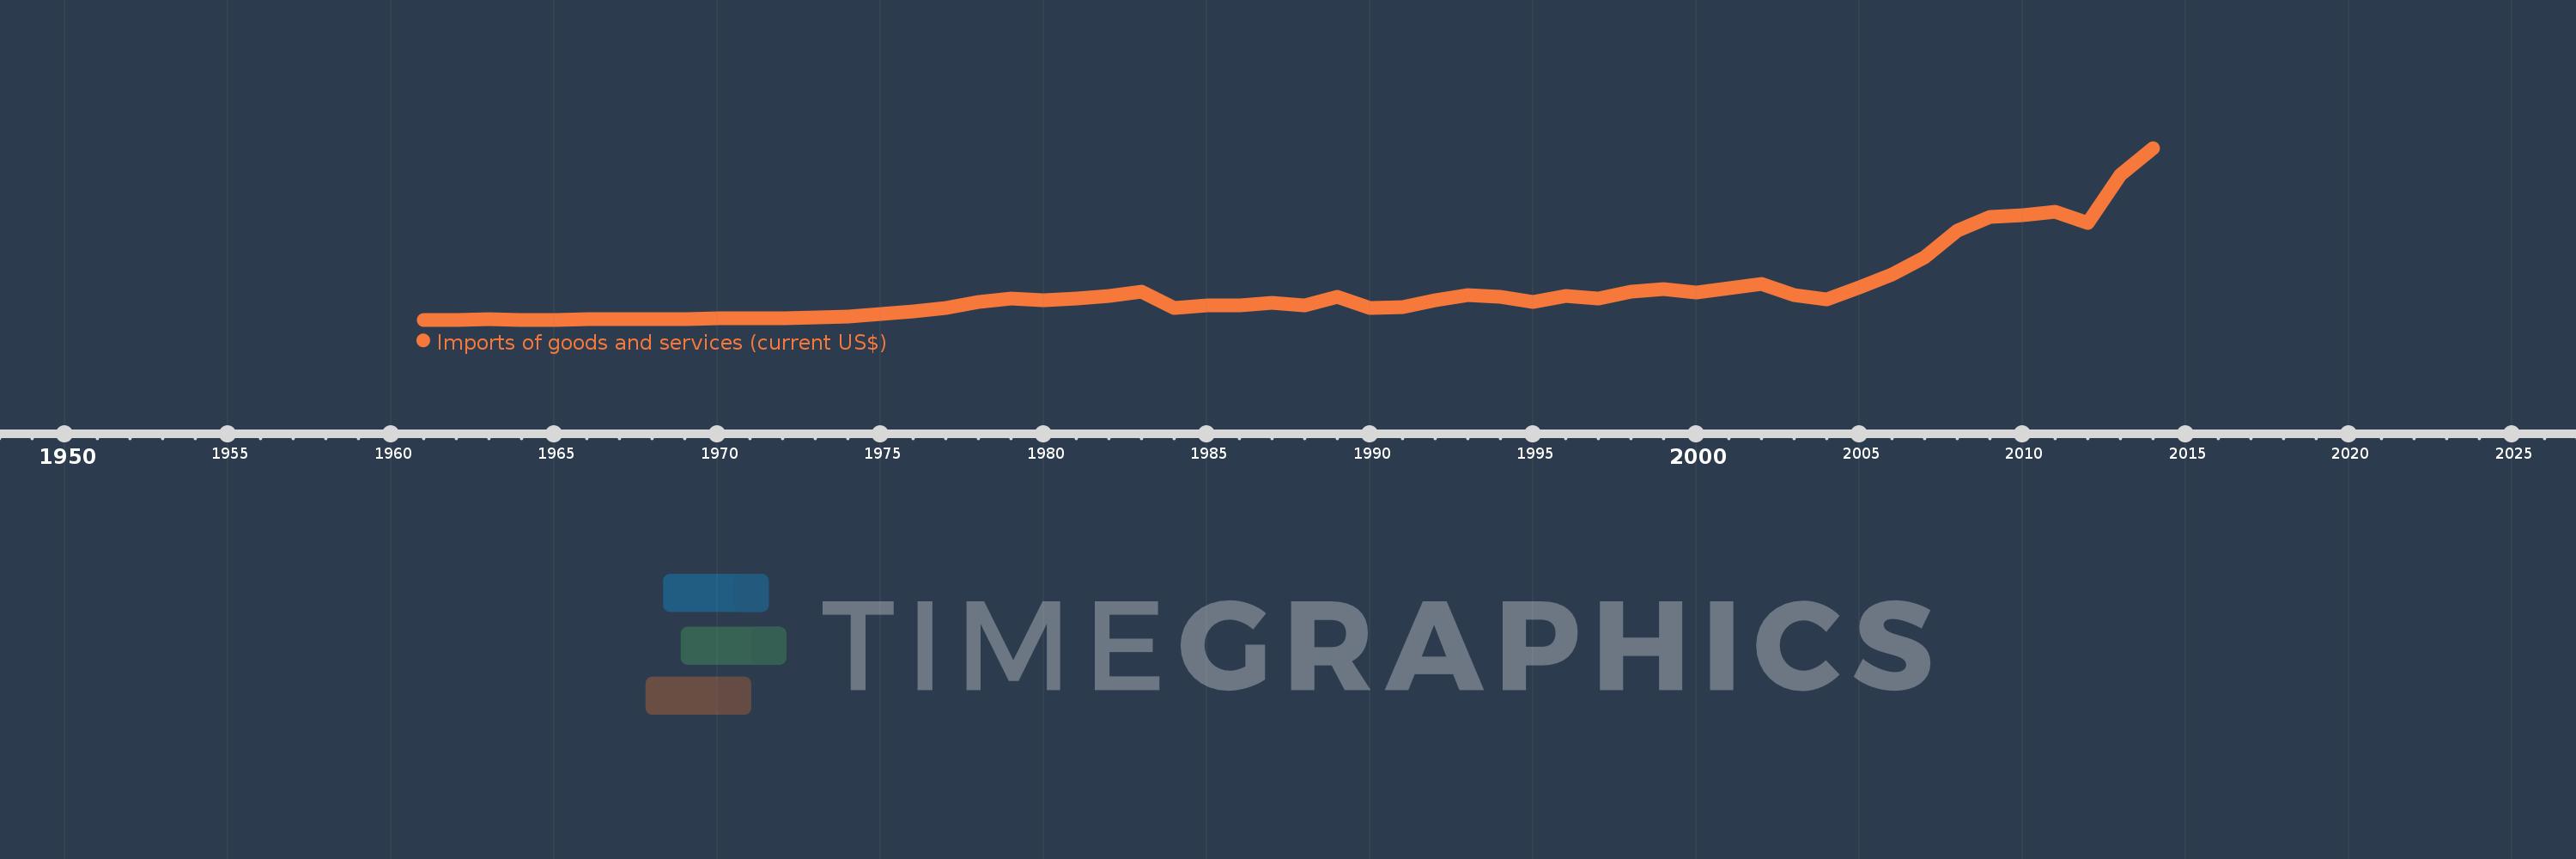
Imports of goods and services (current US$)
2014,2013,2012,2011,2010,2009,2008,2007,2006,2005,2004,2003,2002,2001,2000,1999,1998,1997,1996,1995,1994,1993,1992,1991,1990,1989,1988,1987,1986,1985,1984,1983,1982,1981,1980,1979,1978,1977,1976,1975,1974,1973,1972,1971,1970,1969,1968,1967,1966,1965,1964,1963,1962,1961
This statistics in other country:
AfghanistanAlbaniaAlgeriaAngolaAntigua and BarbudaArab WorldArgentinaArmeniaArubaAustraliaAustriaAzerbaijanBahamas, TheBahrainBangladeshBarbadosBelarusBelgiumBelizeBeninBermudaBhutanBoliviaBosnia and HerzegovinaBotswanaBrazilBrunei DarussalamBulgariaBurkina FasoBurundiCabo VerdeCambodiaCameroonCanadaCaribbean small statesCentral African RepublicCentral Europe and the BalticsChadChileChinaColombiaComorosCongo, Dem. Rep.Congo, Rep.Costa RicaCote d'IvoireCroatiaCubaCyprusCzech RepublicDenmarkDjiboutiDominicaDominican RepublicEarly-demographic dividendEast Asia & PacificEast Asia & Pacific (excluding high income)East Asia & Pacific (IDA & IBRD countries)EcuadorEgypt, Arab Rep.El SalvadorEquatorial GuineaEritreaEstoniaEthiopiaEuro areaEurope & Central AsiaEurope & Central Asia (excluding high income)Europe & Central Asia (IDA & IBRD countries)European UnionFaroe IslandsFijiFinlandFragile and conflict affected situationsFranceFrench PolynesiaGabonGambia, TheGeorgiaGermanyGhanaGreeceGrenadaGuatemalaGuineaGuinea-BissauGuyanaHaitiHeavily indebted poor countries (HIPC)High incomeHondurasHong Kong SAR, ChinaHungaryIBRD onlyIcelandIDA & IBRD totalIDA blendIDA onlyIDA totalIndiaIndonesiaIran, Islamic Rep.IraqIrelandIsraelItalyJamaicaJapanJordanKazakhstanKenyaKiribatiKorea, Rep.KosovoKuwaitKyrgyz RepublicLao PDRLate-demographic dividendLatin America & Caribbean Latin America & Caribbean (excluding high income)Latin America & the Caribbean (IDA & IBRD countries)LatviaLeast developed countries: UN classificationLebanonLesothoLiberiaLibyaLithuaniaLow & middle incomeLow incomeLower middle incomeLuxembourgMacao SAR, ChinaMacedonia, FYRMadagascarMalawiMalaysiaMaldivesMaliMaltaMauritaniaMauritiusMexicoMicronesia, Fed. Sts.Middle East & North AfricaMiddle East & North Africa (excluding high income)Middle East & North Africa (IDA & IBRD countries)Middle incomeMoldovaMongoliaMontenegroMoroccoMozambiqueMyanmarNamibiaNepalNetherlandsNew CaledoniaNew ZealandNicaraguaNigerNigeriaNorth AmericaNorwayOECD membersOmanOther small statesPacific island small statesPakistanPalauPanamaPapua New GuineaParaguayPeruPhilippinesPolandPortugalPost-demographic dividendPre-demographic dividendPuerto RicoQatarRomaniaRussian FederationRwandaSamoaSaudi ArabiaSenegalSerbiaSeychellesSierra LeoneSingaporeSlovak RepublicSloveniaSmall statesSolomon IslandsSomaliaSouth AfricaSouth AsiaSouth Asia (IDA & IBRD)South SudanSpainSri LankaSt. Kitts and NevisSt. LuciaSt. Vincent and the GrenadinesSub-Saharan Africa Sub-Saharan Africa (excluding high income)Sub-Saharan Africa (IDA & IBRD countries)SudanSurinameSwazilandSwedenSwitzerlandSyrian Arab RepublicTajikistanTanzaniaThailandTimor-LesteTogoTongaTrinidad and TobagoTunisiaTurkeyTurkmenistanUgandaUkraineUnited Arab EmiratesUnited KingdomUnited StatesUpper middle incomeUruguayUzbekistanVanuatuVenezuela, RBVietnamWest Bank and GazaWorldYemen, Rep.ZambiaZimbabwe Timeline:
This timeline shows a graph from 1961 to 2014 of Venezuela, RB. No data until 1960. Number of actual observations by date: 54.
Source name:
World Development Indicators
Source organization:
World Bank national accounts data, and OECD National Accounts data files.
Categories, topics:
Economy & Growth, Trade
Last updated:
apr 23, 2017
Indicators value changes by year
Minimum:
1.387 bln
jan 1, 1962
Maximum:
109.592 bln
jan 1, 2014
At the date of observation
Value
Absolute change
Change from previous value
jan 1, 1961
1.412 bln
+1.412 bln
0.0%
jan 1, 1962
1.387 bln
-24.545 mln
-1.74%
jan 1, 1963
1.512 bln
+125.152 mln
9.02%
jan 1, 1964
1.481 bln
-31.576 mln
-2.09%
jan 1, 1965
1.457 bln
-23.909 mln
-1.61%
jan 1, 1966
1.613 bln
+155.913 mln
10.7%
jan 1, 1967
1.505 bln
-107.533 mln
-6.67%
jan 1, 1968
1.613 bln
+107.533 mln
7.14%
jan 1, 1969
1.957 bln
+344.067 mln
21.33%
jan 1, 1970
2.043 bln
+86.0 mln
4.39%
jan 1, 1971
2.172 bln
+129.022 mln
6.32%
jan 1, 1972
2.463 bln
+291.293 mln
13.41%
jan 1, 1973
2.793 bln
+329.886 mln
13.39%
jan 1, 1974
3.263 bln
+470.049 mln
16.83%
jan 1, 1975
4.838 bln
+1.575 bln
48.28%
jan 1, 1976
6.864 bln
+2.025 bln
41.86%
jan 1, 1977
9.069 bln
+2.205 bln
32.13%
jan 1, 1978
12.692 bln
+3.623 bln
39.95%
jan 1, 1979
14.65 bln
+1.958 bln
15.43%
jan 1, 1980
13.728 bln
-922.674 mln
-6.3%
jan 1, 1981
14.628 bln
+900.163 mln
6.56%
jan 1, 1982
16.518 bln
+1.89 bln
12.92%
jan 1, 1983
18.971 bln
+2.453 bln
14.85%
jan 1, 1984
8.799 bln
-10.172 bln
-53.62%
jan 1, 1985
10.533 bln
+1.734 bln
19.71%
jan 1, 1986
10.467 bln
-66.623 mln
-0.63%
jan 1, 1987
11.903 bln
+1.436 bln
13.72%
jan 1, 1988
10.598 bln
-1.304 bln
-10.96%
jan 1, 1989
15.91 bln
+5.312 bln
50.12%
jan 1, 1990
8.882 bln
-7.028 bln
-44.17%
jan 1, 1991
9.492 bln
+609.996 mln
6.87%
jan 1, 1992
13.572 bln
+4.08 bln
42.98%
jan 1, 1993
16.897 bln
+3.325 bln
24.5%
jan 1, 1994
15.799 bln
-1.098 bln
-6.5%
jan 1, 1995
12.606 bln
-3.193 bln
-20.21%
jan 1, 1996
16.342 bln
+3.736 bln
29.63%
jan 1, 1997
14.559 bln
-1.783 bln
-10.91%
jan 1, 1998
18.874 bln
+4.315 bln
29.64%
jan 1, 1999
20.713 bln
+1.839 bln
9.75%
jan 1, 2000
18.771 bln
-1.942 bln
-9.38%
jan 1, 2001
21.218 bln
+2.447 bln
13.03%
jan 1, 2002
23.85 bln
+2.633 bln
12.41%
jan 1, 2003
16.853 bln
-6.997 bln
-29.34%
jan 1, 2004
13.984 bln
-2.868 bln
-17.02%
jan 1, 2005
21.556 bln
+7.572 bln
54.15%
jan 1, 2006
29.784 bln
+8.228 bln
38.17%
jan 1, 2007
40.635 bln
+10.851 bln
36.43%
jan 1, 2008
57.749 bln
+17.114 bln
42.12%
jan 1, 2009
66.299 bln
+8.55 bln
14.81%
jan 1, 2010
67.364 bln
+1.065 bln
1.61%
jan 1, 2011
69.335 bln
+1.97 bln
2.92%
jan 1, 2012
62.332 bln
-7.003 bln
-10.1%
jan 1, 2013
92.395 bln
+30.064 bln
48.23%
jan 1, 2014
109.592 bln
+17.196 bln
18.61%
Ranking of countries by current statistics by years


Comments: