29
/
en
AIzaSyAYiBZKx7MnpbEhh9jyipgxe19OcubqV5w
April 1, 2024
183037
Macao SAR, China
MAC
true
2
1
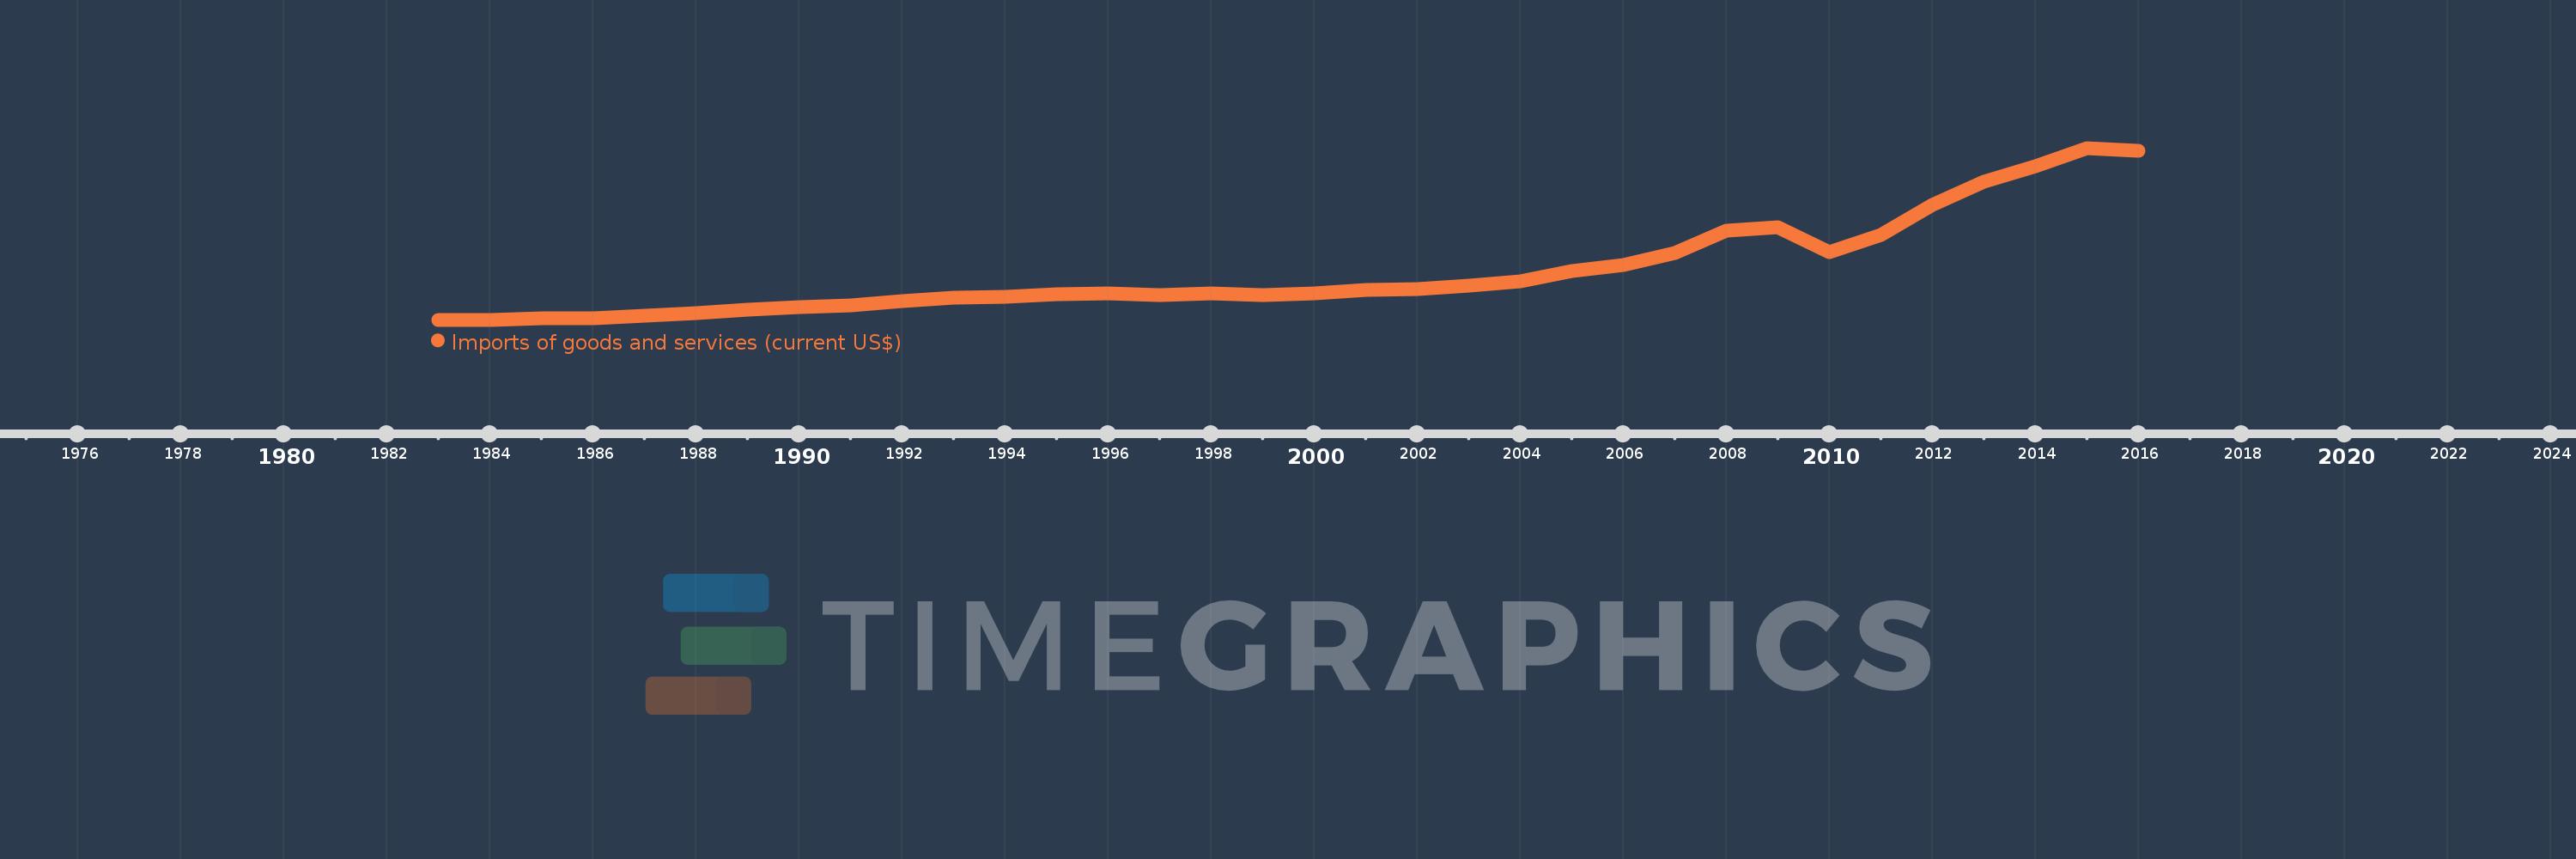
Imports of goods and services (current US$)
2016,2015,2014,2013,2012,2011,2010,2009,2008,2007,2006,2005,2004,2003,2002,2001,2000,1999,1998,1997,1996,1995,1994,1993,1992,1991,1990,1989,1988,1987,1986,1985,1984,1983
This statistics in other country:
AfghanistanAlbaniaAlgeriaAngolaAntigua and BarbudaArab WorldArgentinaArmeniaArubaAustraliaAustriaAzerbaijanBahamas, TheBahrainBangladeshBarbadosBelarusBelgiumBelizeBeninBermudaBhutanBoliviaBosnia and HerzegovinaBotswanaBrazilBrunei DarussalamBulgariaBurkina FasoBurundiCabo VerdeCambodiaCameroonCanadaCaribbean small statesCentral African RepublicCentral Europe and the BalticsChadChileChinaColombiaComorosCongo, Dem. Rep.Congo, Rep.Costa RicaCote d'IvoireCroatiaCubaCyprusCzech RepublicDenmarkDjiboutiDominicaDominican RepublicEarly-demographic dividendEast Asia & PacificEast Asia & Pacific (excluding high income)East Asia & Pacific (IDA & IBRD countries)EcuadorEgypt, Arab Rep.El SalvadorEquatorial GuineaEritreaEstoniaEthiopiaEuro areaEurope & Central AsiaEurope & Central Asia (excluding high income)Europe & Central Asia (IDA & IBRD countries)European UnionFaroe IslandsFijiFinlandFragile and conflict affected situationsFranceFrench PolynesiaGabonGambia, TheGeorgiaGermanyGhanaGreeceGrenadaGuatemalaGuineaGuinea-BissauGuyanaHaitiHeavily indebted poor countries (HIPC)High incomeHondurasHong Kong SAR, ChinaHungaryIBRD onlyIcelandIDA & IBRD totalIDA blendIDA onlyIDA totalIndiaIndonesiaIran, Islamic Rep.IraqIrelandIsraelItalyJamaicaJapanJordanKazakhstanKenyaKiribatiKorea, Rep.KosovoKuwaitKyrgyz RepublicLao PDRLate-demographic dividendLatin America & Caribbean Latin America & Caribbean (excluding high income)Latin America & the Caribbean (IDA & IBRD countries)LatviaLeast developed countries: UN classificationLebanonLesothoLiberiaLibyaLithuaniaLow & middle incomeLow incomeLower middle incomeLuxembourgMacao SAR, ChinaMacedonia, FYRMadagascarMalawiMalaysiaMaldivesMaliMaltaMauritaniaMauritiusMexicoMicronesia, Fed. Sts.Middle East & North AfricaMiddle East & North Africa (excluding high income)Middle East & North Africa (IDA & IBRD countries)Middle incomeMoldovaMongoliaMontenegroMoroccoMozambiqueMyanmarNamibiaNepalNetherlandsNew CaledoniaNew ZealandNicaraguaNigerNigeriaNorth AmericaNorwayOECD membersOmanOther small statesPacific island small statesPakistanPalauPanamaPapua New GuineaParaguayPeruPhilippinesPolandPortugalPost-demographic dividendPre-demographic dividendPuerto RicoQatarRomaniaRussian FederationRwandaSamoaSaudi ArabiaSenegalSerbiaSeychellesSierra LeoneSingaporeSlovak RepublicSloveniaSmall statesSolomon IslandsSomaliaSouth AfricaSouth AsiaSouth Asia (IDA & IBRD)South SudanSpainSri LankaSt. Kitts and NevisSt. LuciaSt. Vincent and the GrenadinesSub-Saharan Africa Sub-Saharan Africa (excluding high income)Sub-Saharan Africa (IDA & IBRD countries)SudanSurinameSwazilandSwedenSwitzerlandSyrian Arab RepublicTajikistanTanzaniaThailandTimor-LesteTogoTongaTrinidad and TobagoTunisiaTurkeyTurkmenistanUgandaUkraineUnited Arab EmiratesUnited KingdomUnited StatesUpper middle incomeUruguayUzbekistanVanuatuVenezuela, RBVietnamWest Bank and GazaWorldYemen, Rep.ZambiaZimbabwe Timeline:
This timeline shows a graph from 1983 to 2016 of Macao SAR, China. No data until 1982. Number of actual observations by date: 34.
Source name:
World Development Indicators
Source organization:
World Bank national accounts data, and OECD National Accounts data files.
Categories, topics:
Economy & Growth, Trade
Last updated:
apr 23, 2017
Indicators value changes by year
Minimum:
1.136 bln
jan 1, 1983
Maximum:
17.382 bln
jan 1, 2015
At the date of observation
Value
Absolute change
Change from previous value
jan 1, 1983
1.136 bln
+1.136 bln
0.0%
jan 1, 1984
1.151 bln
+15.101 mln
1.33%
jan 1, 1985
1.265 bln
+114.121 mln
9.92%
jan 1, 1986
1.256 bln
-9.03 mln
-0.71%
jan 1, 1987
1.479 bln
+223.323 mln
17.78%
jan 1, 1988
1.795 bln
+315.216 mln
21.31%
jan 1, 1989
2.046 bln
+251.681 mln
14.02%
jan 1, 1990
2.341 bln
+294.919 mln
14.41%
jan 1, 1991
2.511 bln
+169.722 mln
7.25%
jan 1, 1992
2.893 bln
+381.702 mln
15.2%
jan 1, 1993
3.194 bln
+301.167 mln
10.41%
jan 1, 1994
3.311 bln
+116.877 mln
3.66%
jan 1, 1995
3.588 bln
+277.474 mln
8.38%
jan 1, 1996
3.622 bln
+34.01 mln
0.95%
jan 1, 1997
3.473 bln
-149.521 mln
-4.13%
jan 1, 1998
3.594 bln
+120.91 mln
3.48%
jan 1, 1999
3.455 bln
-138.344 mln
-3.85%
jan 1, 2000
3.655 bln
+199.923 mln
5.79%
jan 1, 2001
3.944 bln
+288.525 mln
7.89%
jan 1, 2002
4.034 bln
+90.103 mln
2.28%
jan 1, 2003
4.358 bln
+324.321 mln
8.04%
jan 1, 2004
4.777 bln
+419.036 mln
9.62%
jan 1, 2005
5.762 bln
+984.421 mln
20.61%
jan 1, 2006
6.321 bln
+559.967 mln
9.72%
jan 1, 2007
7.473 bln
+1.151 bln
18.21%
jan 1, 2008
9.55 bln
+2.077 bln
27.79%
jan 1, 2009
9.864 bln
+314.695 mln
3.3%
jan 1, 2010
7.565 bln
-2.299 bln
-23.3%
jan 1, 2011
9.183 bln
+1.618 bln
21.39%
jan 1, 2012
11.993 bln
+2.81 bln
30.6%
jan 1, 2013
14.227 bln
+2.234 bln
18.63%
jan 1, 2014
15.673 bln
+1.446 bln
10.17%
jan 1, 2015
17.382 bln
+1.709 bln
10.9%
jan 1, 2016
17.147 bln
-235.504 mln
-1.35%
Ranking of countries by current statistics by years


Comments: