29
/
en
AIzaSyAYiBZKx7MnpbEhh9jyipgxe19OcubqV5w
April 1, 2024
75081
Azerbaijan
AZE
true
2
1
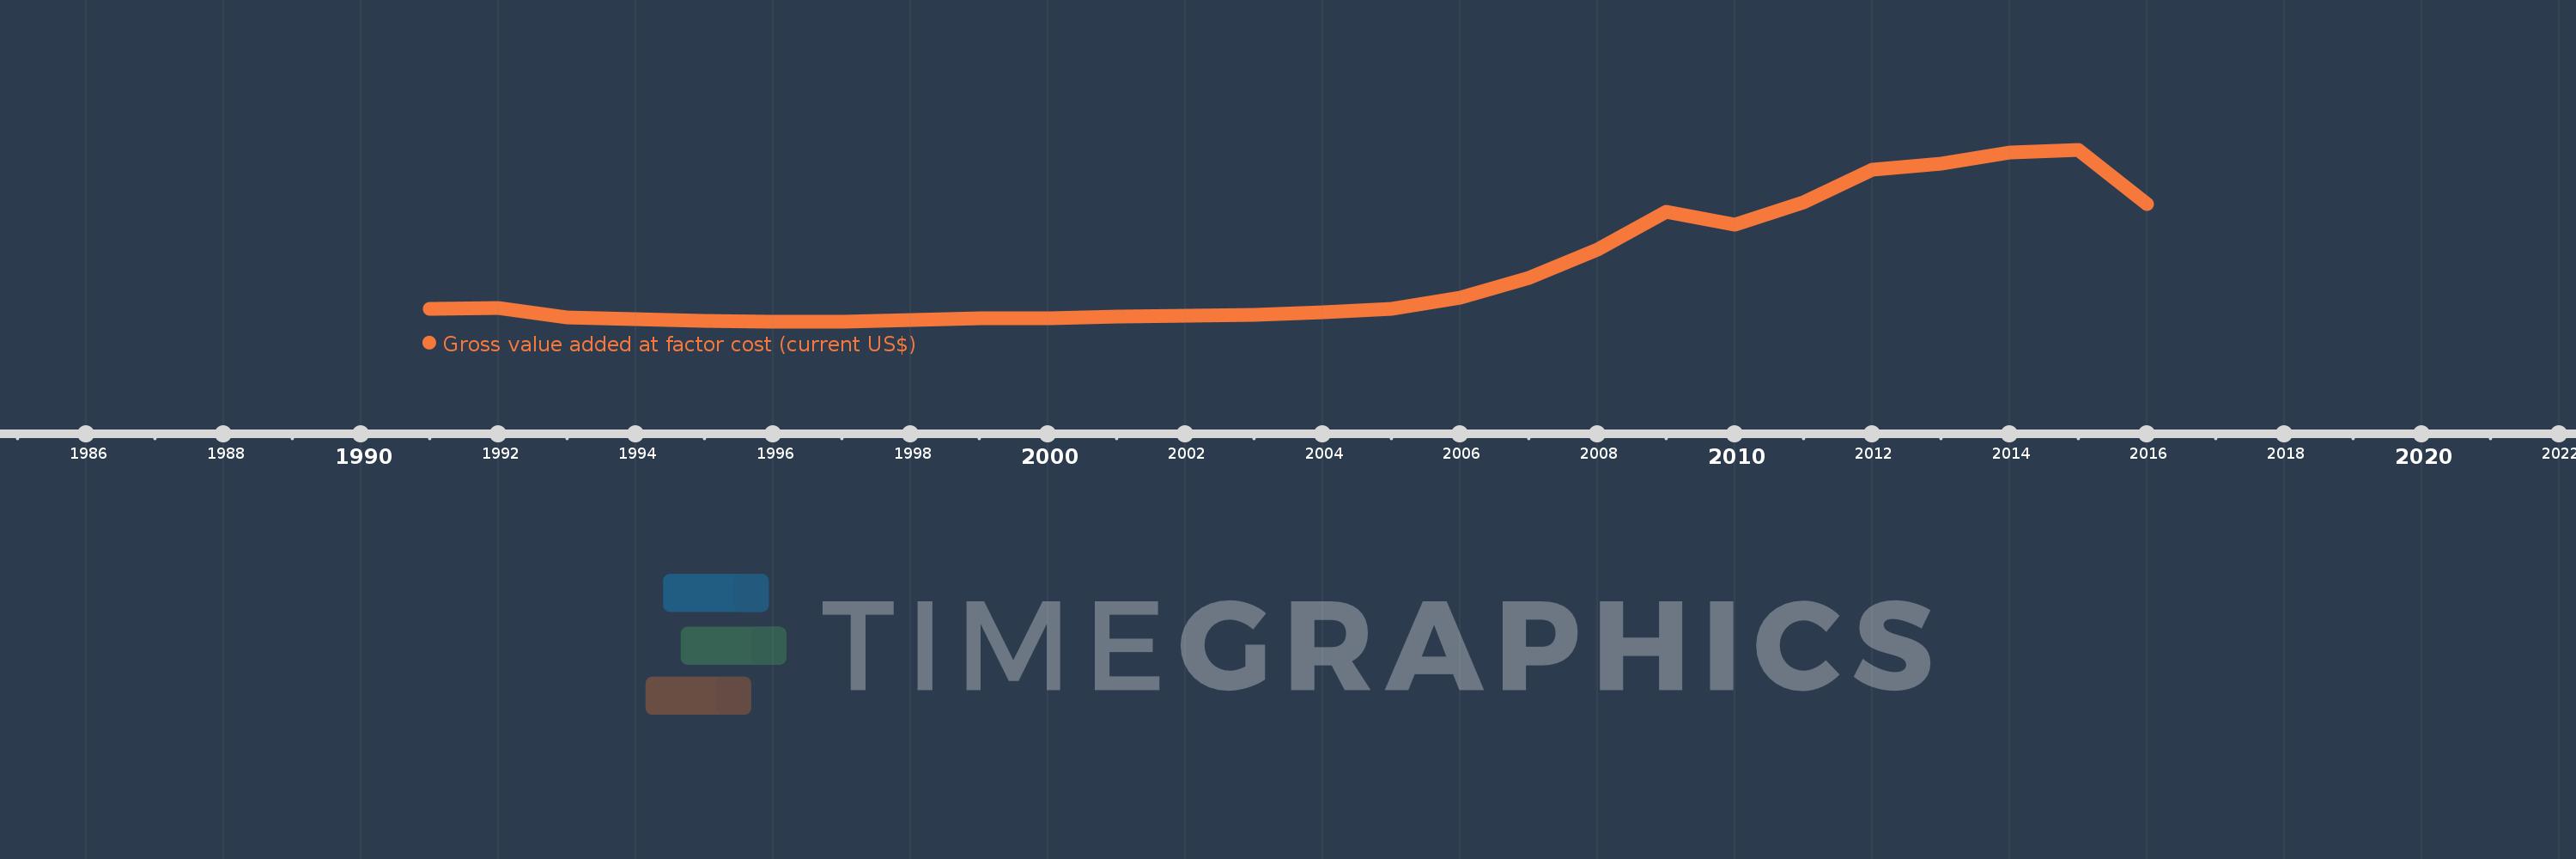
Gross value added at factor cost (current US$)
2016,2015,2014,2013,2012,2011,2010,2009,2008,2007,2006,2005,2004,2003,2002,2001,2000,1999,1998,1997,1996,1995,1994,1993,1992,1991
This statistics in other country:
AfghanistanAlbaniaAlgeriaAndorraAntigua and BarbudaArgentinaArmeniaArubaAustraliaAustriaAzerbaijanBahamas, TheBahrainBangladeshBarbadosBelarusBelgiumBelizeBeninBermudaBhutanBoliviaBosnia and HerzegovinaBotswanaBrazilBulgariaBurkina FasoBurundiCabo VerdeCambodiaCameroonCanadaCaribbean small statesCayman IslandsCentral African RepublicCentral Europe and the BalticsChadChileColombiaCongo, Dem. Rep.Costa RicaCroatiaCubaCyprusCzech RepublicDenmarkDjiboutiDominicaDominican RepublicEarly-demographic dividendEcuadorEgypt, Arab Rep.El SalvadorEquatorial GuineaEritreaEstoniaEthiopiaEuro areaEurope & Central AsiaEurope & Central Asia (excluding high income)Europe & Central Asia (IDA & IBRD countries)European UnionFaroe IslandsFijiFinlandFranceGabonGambia, TheGeorgiaGermanyGhanaGreeceGrenadaGuatemalaGuineaGuinea-BissauGuyanaHeavily indebted poor countries (HIPC)High incomeHondurasHong Kong SAR, ChinaHungaryIcelandIDA blendIDA onlyIDA totalIndiaIndonesiaIran, Islamic Rep.IrelandItalyJamaicaJapanJordanKazakhstanKenyaKiribatiKorea, Rep.KosovoKuwaitKyrgyz RepublicLao PDRLatin America & Caribbean Latin America & Caribbean (excluding high income)Latin America & the Caribbean (IDA & IBRD countries)LatviaLeast developed countries: UN classificationLebanonLesothoLiberiaLibyaLiechtensteinLithuaniaLow incomeLower middle incomeLuxembourgMacao SAR, ChinaMacedonia, FYRMadagascarMalawiMalaysiaMaldivesMaliMaltaMarshall IslandsMauritaniaMauritiusMexicoMicronesia, Fed. Sts.Middle East & North Africa (excluding high income)Middle East & North Africa (IDA & IBRD countries)MoldovaMongoliaMontenegroMoroccoMozambiqueNamibiaNepalNetherlandsNew ZealandNicaraguaNigeriaNorth AmericaNorwayOECD membersOmanPacific island small statesPakistanPalauPanamaPapua New GuineaParaguayPeruPolandPortugalPost-demographic dividendPre-demographic dividendRomaniaRussian FederationRwandaSao Tome and PrincipeSenegalSerbiaSeychellesSierra LeoneSingaporeSlovak RepublicSloveniaSolomon IslandsSouth AfricaSouth AsiaSouth Asia (IDA & IBRD)SpainSri LankaSt. Kitts and NevisSt. LuciaSt. Vincent and the GrenadinesSub-Saharan Africa Sub-Saharan Africa (excluding high income)Sub-Saharan Africa (IDA & IBRD countries)SudanSurinameSwazilandSwedenSwitzerlandSyrian Arab RepublicTajikistanTanzaniaThailandTimor-LesteTongaTrinidad and TobagoTunisiaTurkeyTurkmenistanTuvaluUgandaUkraineUnited KingdomUnited StatesUruguayUzbekistanVanuatuVenezuela, RBVietnamWest Bank and GazaWorldYemen, Rep.ZambiaZimbabwe Timeline:
This timeline shows a graph from 1991 to 2016 of Azerbaijan. No data until 1990. Number of actual observations by date: 26.
Source name:
World Development Indicators
Source organization:
World Bank national accounts data, and OECD National Accounts data files.
Categories, topics:
Economy & Growth
Last updated:
apr 23, 2017
Indicators value changes by year
Minimum:
2.816 bln
jan 1, 1996
Maximum:
69.689 bln
jan 1, 2015
At the date of observation
Value
Absolute change
Change from previous value
jan 1, 1991
8.088 bln
+8.088 bln
0.0%
jan 1, 1992
8.294 bln
+206.233 mln
2.55%
jan 1, 1993
4.563 bln
-3.731 bln
-44.98%
jan 1, 1994
3.779 bln
-784.327 mln
-17.19%
jan 1, 1995
3.249 bln
-529.731 mln
-14.02%
jan 1, 1996
2.816 bln
-432.854 mln
-13.32%
jan 1, 1997
2.857 bln
+40.913 mln
1.45%
jan 1, 1998
3.67 bln
+812.63 mln
28.44%
jan 1, 1999
4.263 bln
+593.51 mln
16.17%
jan 1, 2000
4.4 bln
+136.99 mln
3.21%
jan 1, 2001
4.947 bln
+547.006 mln
12.43%
jan 1, 2002
5.258 bln
+311.191 mln
6.29%
jan 1, 2003
5.736 bln
+477.459 mln
9.08%
jan 1, 2004
6.716 bln
+980.24 mln
17.09%
jan 1, 2005
8.054 bln
+1.338 bln
19.92%
jan 1, 2006
12.244 bln
+4.19 bln
52.03%
jan 1, 2007
19.836 bln
+7.592 bln
62.01%
jan 1, 2008
30.871 bln
+11.034 bln
55.63%
jan 1, 2009
45.58 bln
+14.709 bln
47.65%
jan 1, 2010
40.796 bln
-4.784 bln
-10.5%
jan 1, 2011
49.54 bln
+8.744 bln
21.43%
jan 1, 2012
62.082 bln
+12.542 bln
25.32%
jan 1, 2013
64.505 bln
+2.423 bln
3.9%
jan 1, 2014
68.855 bln
+4.35 bln
6.74%
jan 1, 2015
69.689 bln
+833.955 mln
1.21%
jan 1, 2016
48.65 bln
-21.039 bln
-30.19%
Ranking of countries by current statistics by years


Comments: