29
/
en
AIzaSyAYiBZKx7MnpbEhh9jyipgxe19OcubqV5w
April 1, 2024
220917
Paraguay
PRY
true
2
1
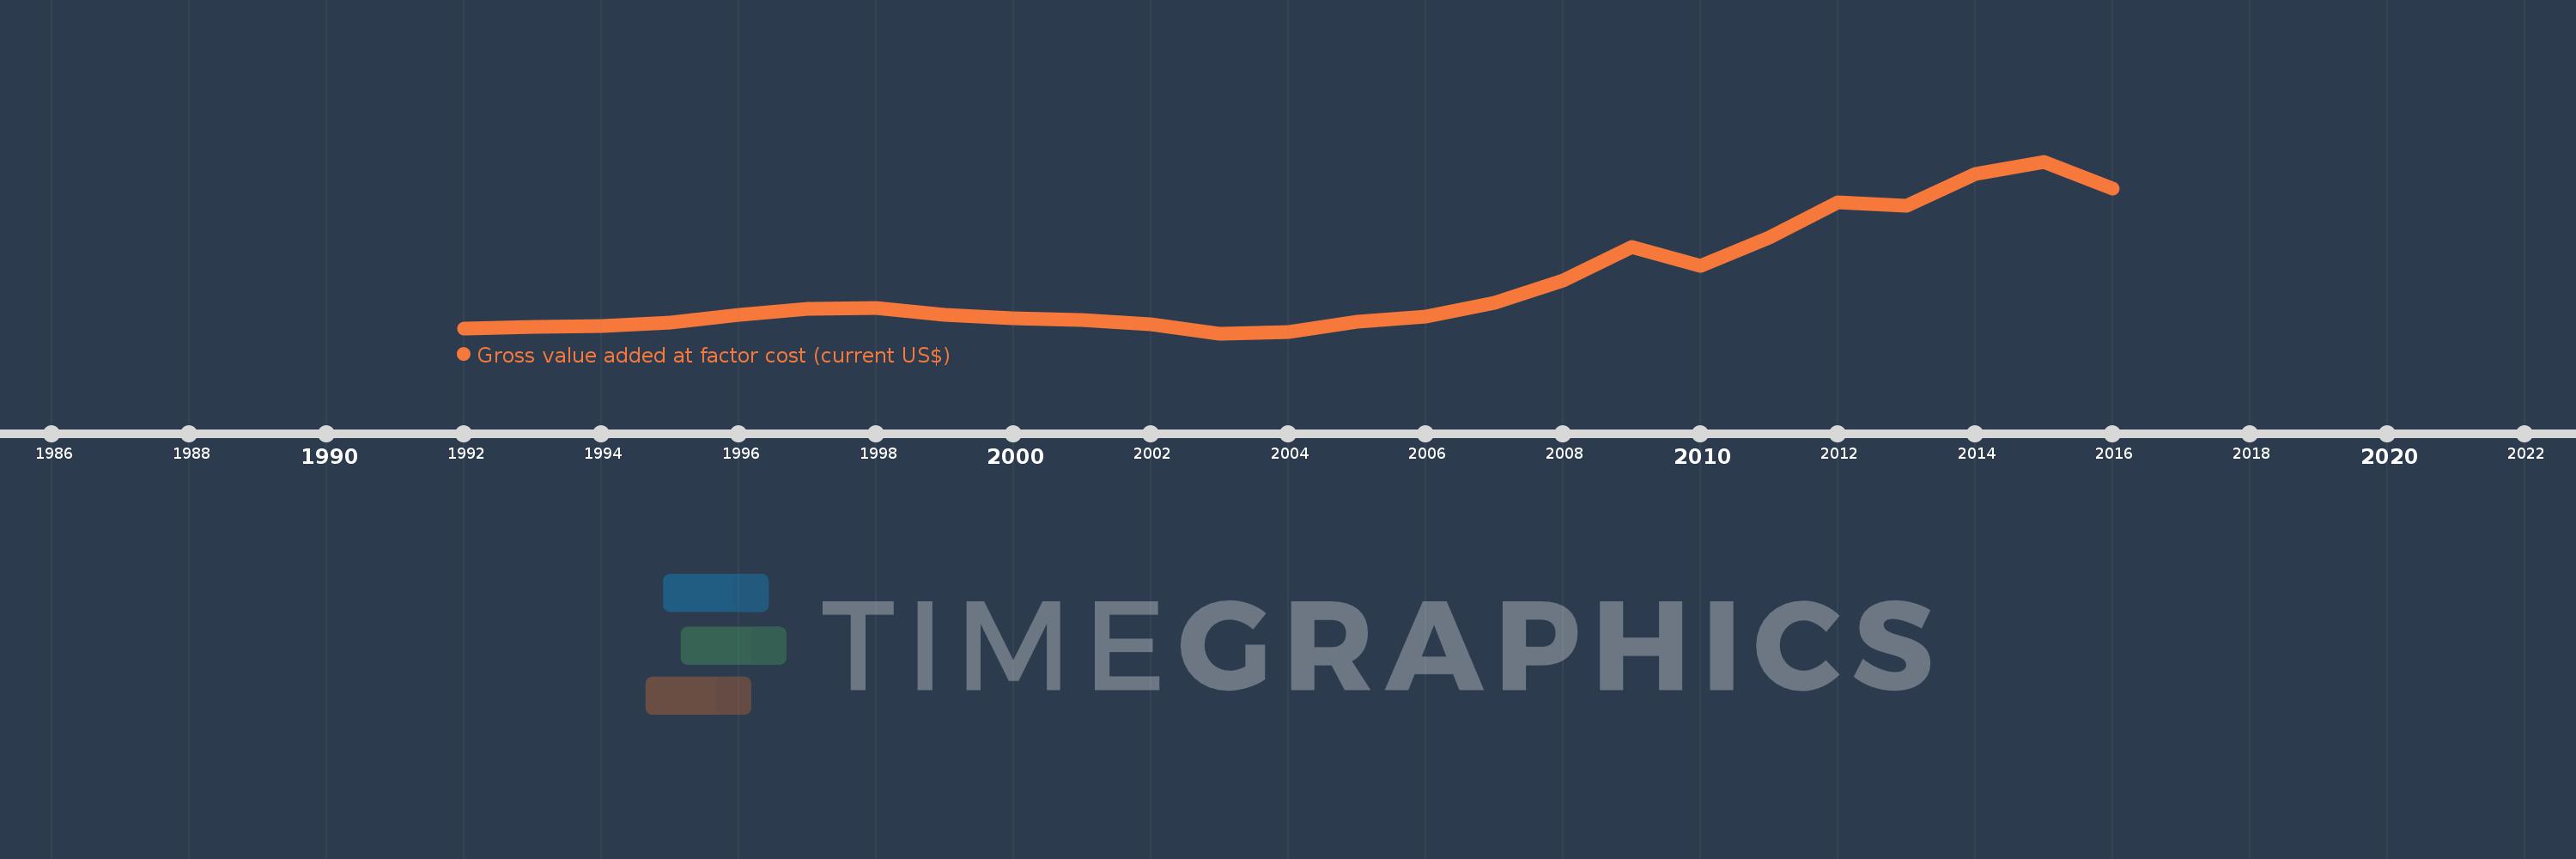
Gross value added at factor cost (current US$)
2016,2015,2014,2013,2012,2011,2010,2009,2008,2007,2006,2005,2004,2003,2002,2001,2000,1999,1998,1997,1996,1995,1994,1993,1992
This statistics in other country:
AfghanistanAlbaniaAlgeriaAndorraAntigua and BarbudaArgentinaArmeniaArubaAustraliaAustriaAzerbaijanBahamas, TheBahrainBangladeshBarbadosBelarusBelgiumBelizeBeninBermudaBhutanBoliviaBosnia and HerzegovinaBotswanaBrazilBulgariaBurkina FasoBurundiCabo VerdeCambodiaCameroonCanadaCaribbean small statesCayman IslandsCentral African RepublicCentral Europe and the BalticsChadChileColombiaCongo, Dem. Rep.Costa RicaCroatiaCubaCyprusCzech RepublicDenmarkDjiboutiDominicaDominican RepublicEarly-demographic dividendEcuadorEgypt, Arab Rep.El SalvadorEquatorial GuineaEritreaEstoniaEthiopiaEuro areaEurope & Central AsiaEurope & Central Asia (excluding high income)Europe & Central Asia (IDA & IBRD countries)European UnionFaroe IslandsFijiFinlandFranceGabonGambia, TheGeorgiaGermanyGhanaGreeceGrenadaGuatemalaGuineaGuinea-BissauGuyanaHeavily indebted poor countries (HIPC)High incomeHondurasHong Kong SAR, ChinaHungaryIcelandIDA blendIDA onlyIDA totalIndiaIndonesiaIran, Islamic Rep.IrelandItalyJamaicaJapanJordanKazakhstanKenyaKiribatiKorea, Rep.KosovoKuwaitKyrgyz RepublicLao PDRLatin America & Caribbean Latin America & Caribbean (excluding high income)Latin America & the Caribbean (IDA & IBRD countries)LatviaLeast developed countries: UN classificationLebanonLesothoLiberiaLibyaLiechtensteinLithuaniaLow incomeLower middle incomeLuxembourgMacao SAR, ChinaMacedonia, FYRMadagascarMalawiMalaysiaMaldivesMaliMaltaMarshall IslandsMauritaniaMauritiusMexicoMicronesia, Fed. Sts.Middle East & North Africa (excluding high income)Middle East & North Africa (IDA & IBRD countries)MoldovaMongoliaMontenegroMoroccoMozambiqueNamibiaNepalNetherlandsNew ZealandNicaraguaNigeriaNorth AmericaNorwayOECD membersOmanPacific island small statesPakistanPalauPanamaPapua New GuineaParaguayPeruPolandPortugalPost-demographic dividendPre-demographic dividendRomaniaRussian FederationRwandaSao Tome and PrincipeSenegalSerbiaSeychellesSierra LeoneSingaporeSlovak RepublicSloveniaSolomon IslandsSouth AfricaSouth AsiaSouth Asia (IDA & IBRD)SpainSri LankaSt. Kitts and NevisSt. LuciaSt. Vincent and the GrenadinesSub-Saharan Africa Sub-Saharan Africa (excluding high income)Sub-Saharan Africa (IDA & IBRD countries)SudanSurinameSwazilandSwedenSwitzerlandSyrian Arab RepublicTajikistanTanzaniaThailandTimor-LesteTongaTrinidad and TobagoTunisiaTurkeyTurkmenistanTuvaluUgandaUkraineUnited KingdomUnited StatesUruguayUzbekistanVanuatuVenezuela, RBVietnamWest Bank and GazaWorldYemen, Rep.ZambiaZimbabwe Timeline:
This timeline shows a graph from 1992 to 2016 of Paraguay. No data until 1991. Number of actual observations by date: 25.
Source name:
World Development Indicators
Source organization:
World Bank national accounts data, and OECD National Accounts data files.
Categories, topics:
Economy & Growth
Last updated:
apr 23, 2017
Indicators value changes by year
Minimum:
5.928 bln
jan 1, 2003
Maximum:
27.864 bln
jan 1, 2015
At the date of observation
Value
Absolute change
Change from previous value
jan 1, 1992
6.569 bln
+6.569 bln
0.0%
jan 1, 1993
6.762 bln
+193.644 mln
2.95%
jan 1, 1994
6.815 bln
+53.071 mln
0.78%
jan 1, 1995
7.278 bln
+462.745 mln
6.79%
jan 1, 1996
8.312 bln
+1.034 bln
14.2%
jan 1, 1997
9.043 bln
+731.237 mln
8.8%
jan 1, 1998
9.188 bln
+145.18 mln
1.61%
jan 1, 1999
8.33 bln
-857.847 mln
-9.34%
jan 1, 2000
7.83 bln
-500.486 mln
-6.01%
jan 1, 2001
7.608 bln
-222.241 mln
-2.84%
jan 1, 2002
7.113 bln
-494.294 mln
-6.5%
jan 1, 2003
5.928 bln
-1.185 bln
-16.66%
jan 1, 2004
6.131 bln
+202.704 mln
3.42%
jan 1, 2005
7.399 bln
+1.268 bln
20.69%
jan 1, 2006
8.073 bln
+674.567 mln
9.12%
jan 1, 2007
9.815 bln
+1.741 bln
21.57%
jan 1, 2008
12.669 bln
+2.854 bln
29.08%
jan 1, 2009
16.917 bln
+4.249 bln
33.54%
jan 1, 2010
14.537 bln
-2.381 bln
-14.07%
jan 1, 2011
18.114 bln
+3.577 bln
24.61%
jan 1, 2012
22.646 bln
+4.532 bln
25.02%
jan 1, 2013
22.178 bln
-467.75 mln
-2.07%
jan 1, 2014
26.295 bln
+4.117 bln
18.56%
jan 1, 2015
27.864 bln
+1.569 bln
5.97%
jan 1, 2016
24.455 bln
-3.408 bln
-12.23%
Ranking of countries by current statistics by years


Comments: