29
/
en
AIzaSyAYiBZKx7MnpbEhh9jyipgxe19OcubqV5w
April 1, 2024
265836
Tonga
TON
true
2
1
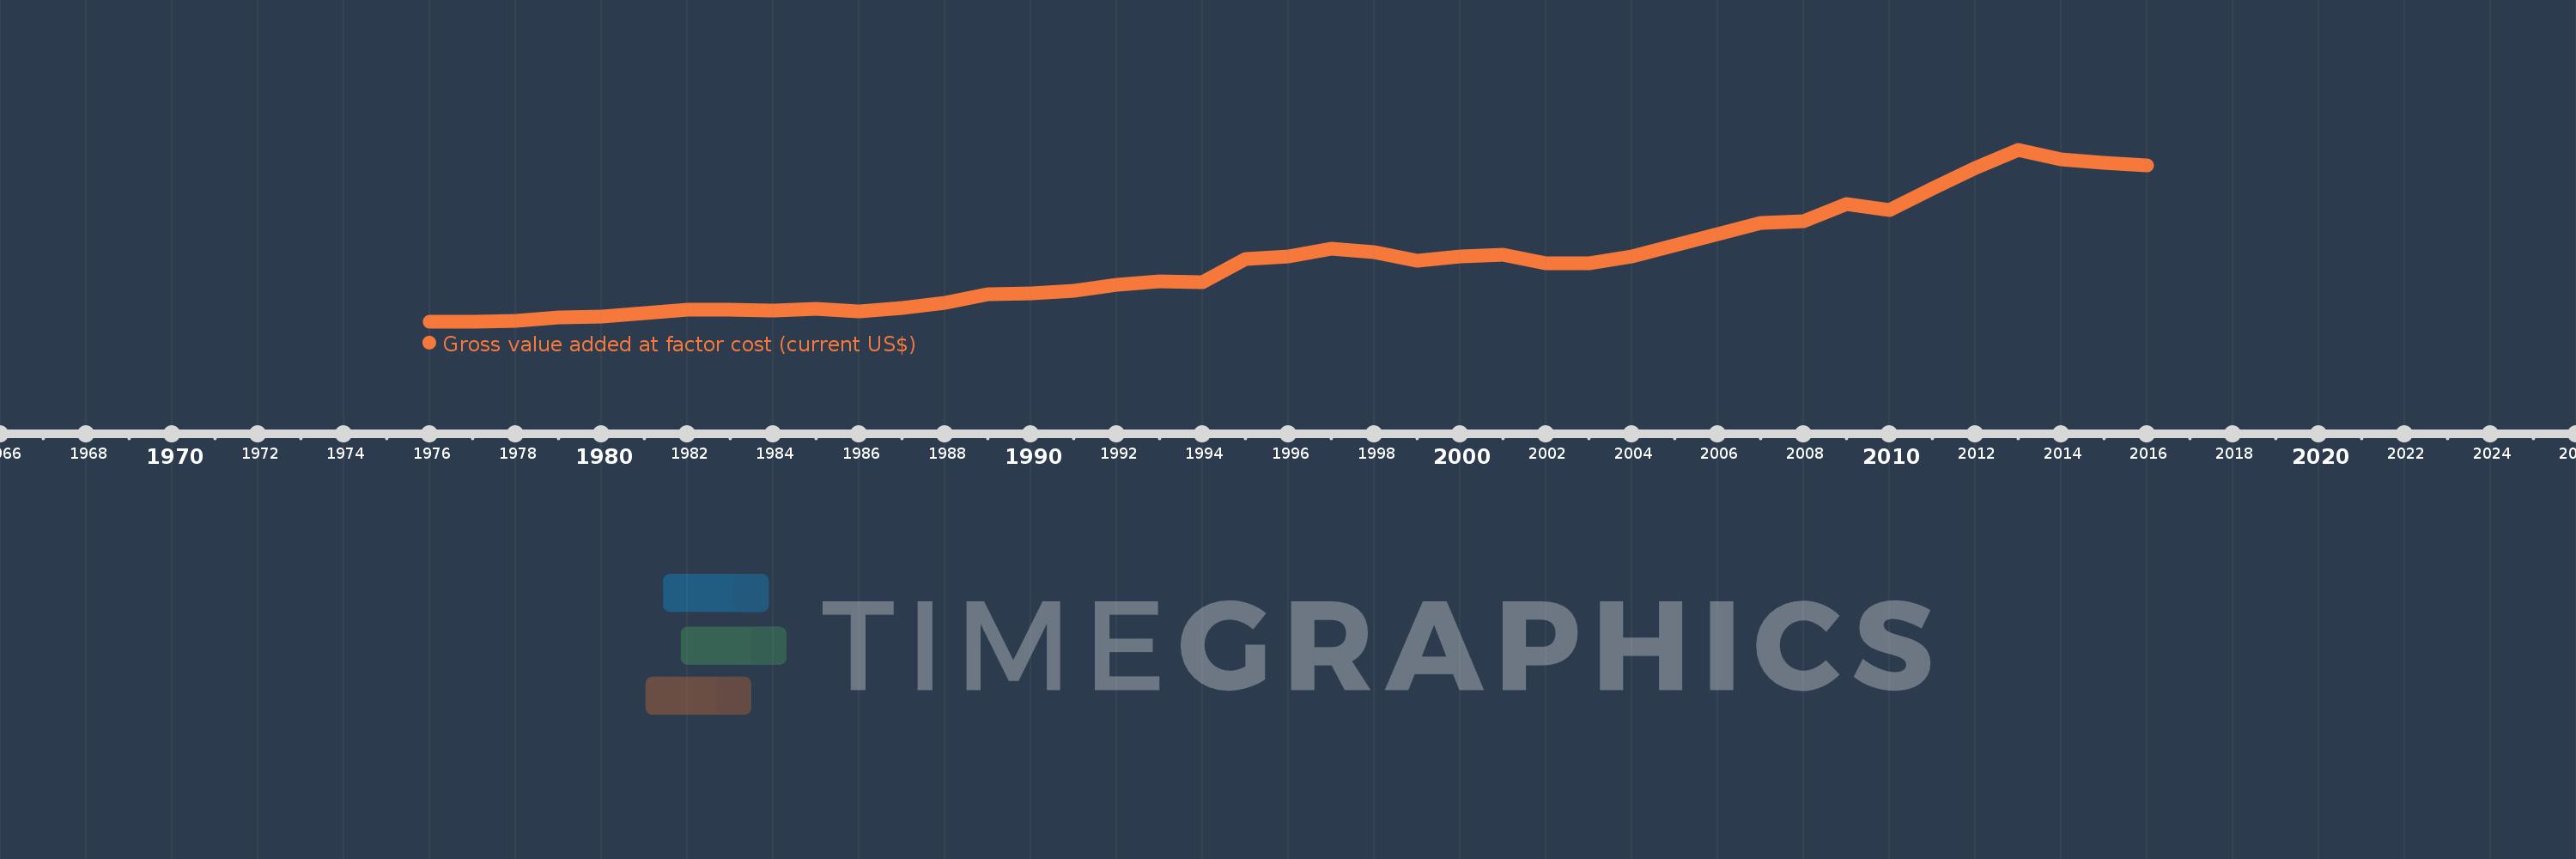
Gross value added at factor cost (current US$)
2016,2015,2014,2013,2012,2011,2010,2009,2008,2007,2006,2005,2004,2003,2002,2001,2000,1999,1998,1997,1996,1995,1994,1993,1992,1991,1990,1989,1988,1987,1986,1985,1984,1983,1982,1981,1980,1979,1978,1977,1976
This statistics in other country:
AfghanistanAlbaniaAlgeriaAndorraAntigua and BarbudaArgentinaArmeniaArubaAustraliaAustriaAzerbaijanBahamas, TheBahrainBangladeshBarbadosBelarusBelgiumBelizeBeninBermudaBhutanBoliviaBosnia and HerzegovinaBotswanaBrazilBulgariaBurkina FasoBurundiCabo VerdeCambodiaCameroonCanadaCaribbean small statesCayman IslandsCentral African RepublicCentral Europe and the BalticsChadChileColombiaCongo, Dem. Rep.Costa RicaCroatiaCubaCyprusCzech RepublicDenmarkDjiboutiDominicaDominican RepublicEarly-demographic dividendEcuadorEgypt, Arab Rep.El SalvadorEquatorial GuineaEritreaEstoniaEthiopiaEuro areaEurope & Central AsiaEurope & Central Asia (excluding high income)Europe & Central Asia (IDA & IBRD countries)European UnionFaroe IslandsFijiFinlandFranceGabonGambia, TheGeorgiaGermanyGhanaGreeceGrenadaGuatemalaGuineaGuinea-BissauGuyanaHeavily indebted poor countries (HIPC)High incomeHondurasHong Kong SAR, ChinaHungaryIcelandIDA blendIDA onlyIDA totalIndiaIndonesiaIran, Islamic Rep.IrelandItalyJamaicaJapanJordanKazakhstanKenyaKiribatiKorea, Rep.KosovoKuwaitKyrgyz RepublicLao PDRLatin America & Caribbean Latin America & Caribbean (excluding high income)Latin America & the Caribbean (IDA & IBRD countries)LatviaLeast developed countries: UN classificationLebanonLesothoLiberiaLibyaLiechtensteinLithuaniaLow incomeLower middle incomeLuxembourgMacao SAR, ChinaMacedonia, FYRMadagascarMalawiMalaysiaMaldivesMaliMaltaMarshall IslandsMauritaniaMauritiusMexicoMicronesia, Fed. Sts.Middle East & North Africa (excluding high income)Middle East & North Africa (IDA & IBRD countries)MoldovaMongoliaMontenegroMoroccoMozambiqueNamibiaNepalNetherlandsNew ZealandNicaraguaNigeriaNorth AmericaNorwayOECD membersOmanPacific island small statesPakistanPalauPanamaPapua New GuineaParaguayPeruPolandPortugalPost-demographic dividendPre-demographic dividendRomaniaRussian FederationRwandaSao Tome and PrincipeSenegalSerbiaSeychellesSierra LeoneSingaporeSlovak RepublicSloveniaSolomon IslandsSouth AfricaSouth AsiaSouth Asia (IDA & IBRD)SpainSri LankaSt. Kitts and NevisSt. LuciaSt. Vincent and the GrenadinesSub-Saharan Africa Sub-Saharan Africa (excluding high income)Sub-Saharan Africa (IDA & IBRD countries)SudanSurinameSwazilandSwedenSwitzerlandSyrian Arab RepublicTajikistanTanzaniaThailandTimor-LesteTongaTrinidad and TobagoTunisiaTurkeyTurkmenistanTuvaluUgandaUkraineUnited KingdomUnited StatesUruguayUzbekistanVanuatuVenezuela, RBVietnamWest Bank and GazaWorldYemen, Rep.ZambiaZimbabwe Timeline:
This timeline shows a graph from 1976 to 2016 of Tonga. No data until 1975. Number of actual observations by date: 41.
Source name:
World Development Indicators
Source organization:
World Bank national accounts data, and OECD National Accounts data files.
Categories, topics:
Economy & Growth
Last updated:
apr 23, 2017
Indicators value changes by year
Minimum:
26.224 mln
jan 1, 1977
Maximum:
412.797 mln
jan 1, 2013
At the date of observation
Value
Absolute change
Change from previous value
jan 1, 1976
27.509 mln
+27.509 mln
0.0%
jan 1, 1977
26.224 mln
-1.286 mln
-4.67%
jan 1, 1978
29.585 mln
+3.362 mln
12.82%
jan 1, 1979
35.512 mln
+5.927 mln
20.03%
jan 1, 1980
38.8 mln
+3.287 mln
9.26%
jan 1, 1981
46.212 mln
+7.412 mln
19.1%
jan 1, 1982
53.892 mln
+7.681 mln
16.62%
jan 1, 1983
53.27 mln
-622.1K
-1.15%
jan 1, 1984
52.144 mln
-1.126 mln
-2.11%
jan 1, 1985
55.391 mln
+3.247 mln
6.23%
jan 1, 1986
50.645 mln
-4.746 mln
-8.57%
jan 1, 1987
57.651 mln
+7.006 mln
13.83%
jan 1, 1988
68.819 mln
+11.168 mln
19.37%
jan 1, 1989
88.925 mln
+20.106 mln
29.21%
jan 1, 1990
89.843 mln
+917.608K
1.03%
jan 1, 1991
95.442 mln
+5.6 mln
6.23%
jan 1, 1992
109.985 mln
+14.542 mln
15.24%
jan 1, 1993
117.769 mln
+7.784 mln
7.08%
jan 1, 1994
115.777 mln
-1.992 mln
-1.69%
jan 1, 1995
167.699 mln
+51.922 mln
44.85%
jan 1, 1996
174.62 mln
+6.921 mln
4.13%
jan 1, 1997
190.348 mln
+15.729 mln
9.01%
jan 1, 1998
182.689 mln
-7.659 mln
-4.02%
jan 1, 1999
164.494 mln
-18.195 mln
-9.96%
jan 1, 2000
173.28 mln
+8.786 mln
5.34%
jan 1, 2001
176.995 mln
+3.715 mln
2.14%
jan 1, 2002
158.637 mln
-18.358 mln
-10.37%
jan 1, 2003
157.512 mln
-1.125 mln
-0.71%
jan 1, 2004
173.002 mln
+15.49 mln
9.83%
jan 1, 2005
198.171 mln
+25.169 mln
14.55%
jan 1, 2006
224.854 mln
+26.683 mln
13.46%
jan 1, 2007
249.259 mln
+24.405 mln
10.85%
jan 1, 2008
252.382 mln
+3.123 mln
1.25%
jan 1, 2009
291.135 mln
+38.753 mln
15.36%
jan 1, 2010
277.374 mln
-13.762 mln
-4.73%
jan 1, 2011
325.706 mln
+48.333 mln
17.43%
jan 1, 2012
373.118 mln
+47.412 mln
14.56%
jan 1, 2013
412.797 mln
+39.679 mln
10.63%
jan 1, 2014
391.536 mln
-21.261 mln
-5.15%
jan 1, 2015
384.014 mln
-7.522 mln
-1.92%
jan 1, 2016
378.71 mln
-5.304 mln
-1.38%
Ranking of countries by current statistics by years


Comments: