29
/
en
AIzaSyAYiBZKx7MnpbEhh9jyipgxe19OcubqV5w
April 1, 2024
185259
Madagascar
MDG
true
2
1
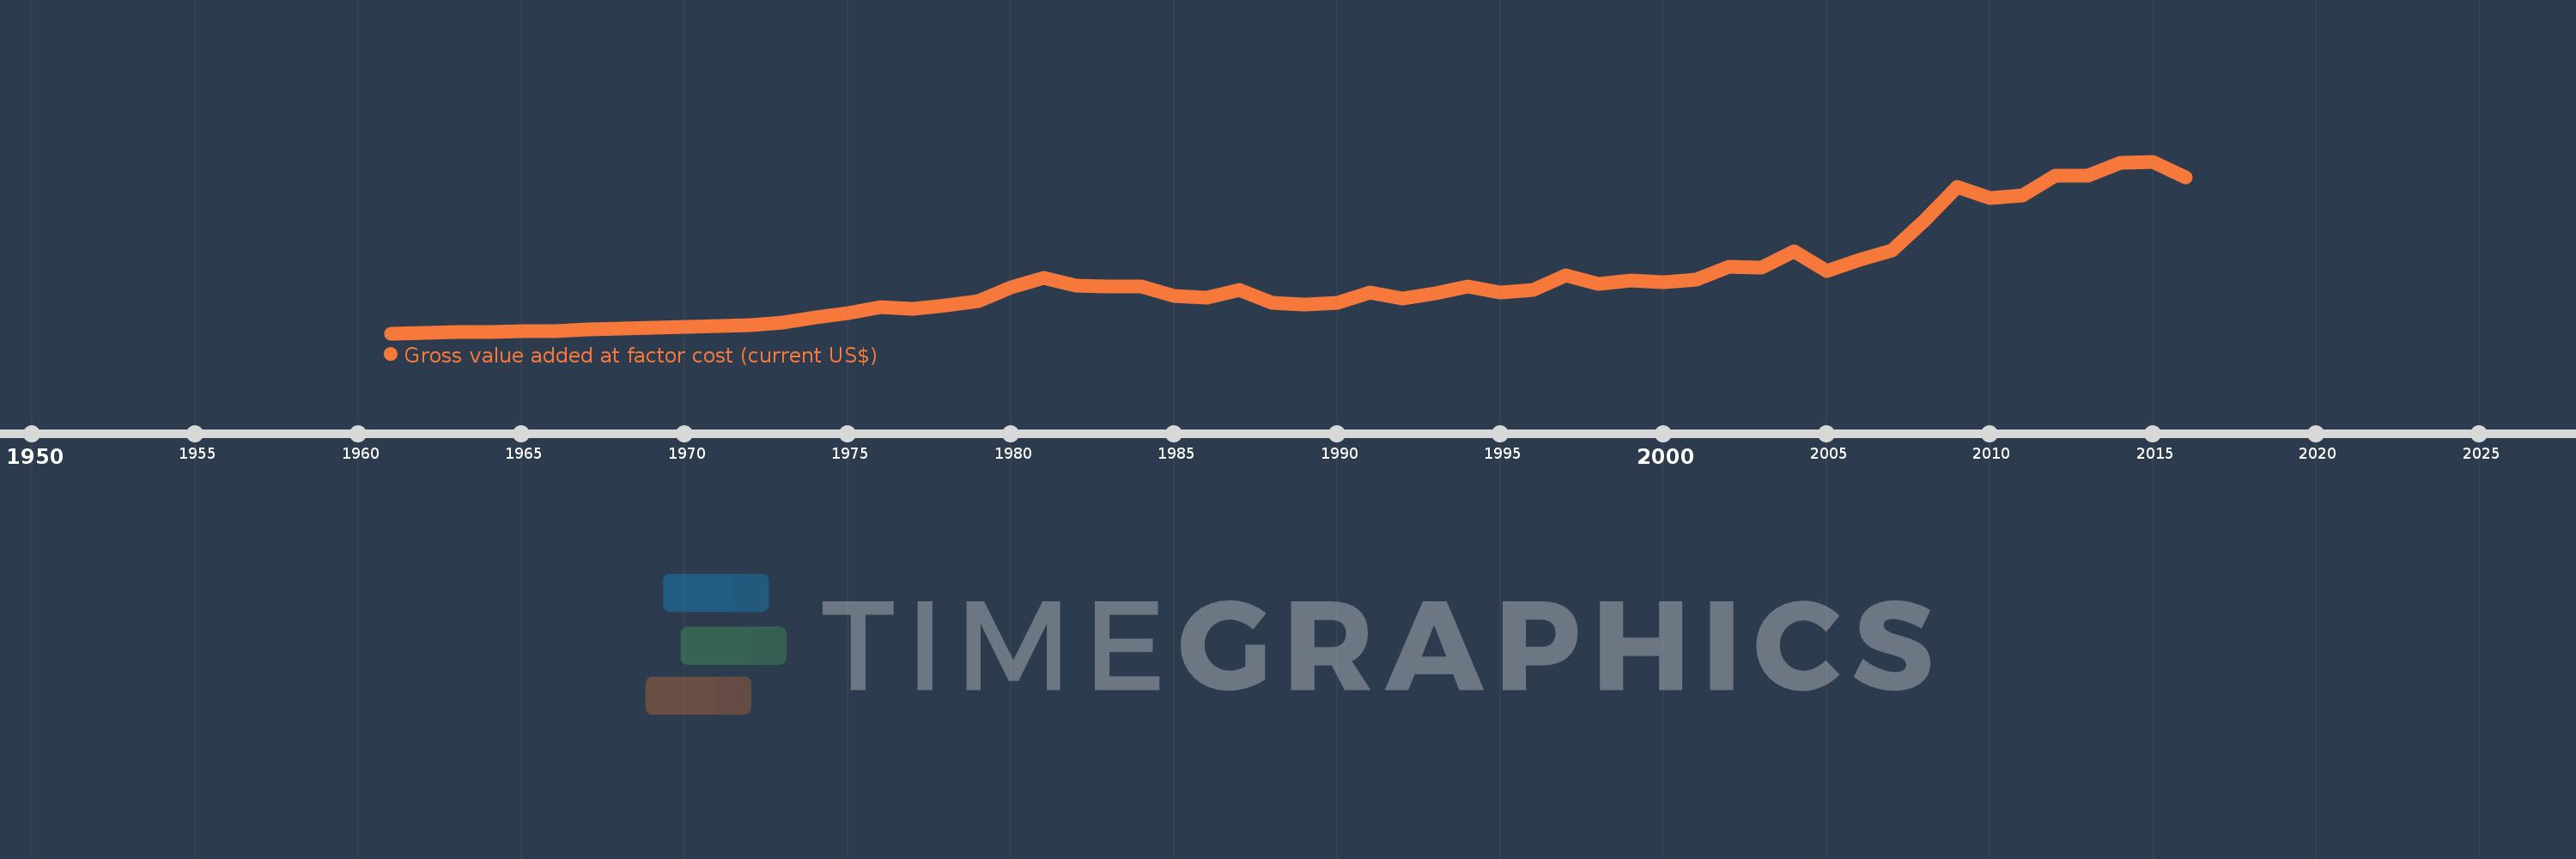
Gross value added at factor cost (current US$)
2016,2015,2014,2013,2012,2011,2010,2009,2008,2007,2006,2005,2004,2003,2002,2001,2000,1999,1998,1997,1996,1995,1994,1993,1992,1991,1990,1989,1988,1987,1986,1985,1984,1983,1982,1981,1980,1979,1978,1977,1976,1975,1974,1973,1972,1971,1970,1969,1968,1967,1966,1965,1964,1963,1962,1961
This statistics in other country:
AfghanistanAlbaniaAlgeriaAndorraAntigua and BarbudaArgentinaArmeniaArubaAustraliaAustriaAzerbaijanBahamas, TheBahrainBangladeshBarbadosBelarusBelgiumBelizeBeninBermudaBhutanBoliviaBosnia and HerzegovinaBotswanaBrazilBulgariaBurkina FasoBurundiCabo VerdeCambodiaCameroonCanadaCaribbean small statesCayman IslandsCentral African RepublicCentral Europe and the BalticsChadChileColombiaCongo, Dem. Rep.Costa RicaCroatiaCubaCyprusCzech RepublicDenmarkDjiboutiDominicaDominican RepublicEarly-demographic dividendEcuadorEgypt, Arab Rep.El SalvadorEquatorial GuineaEritreaEstoniaEthiopiaEuro areaEurope & Central AsiaEurope & Central Asia (excluding high income)Europe & Central Asia (IDA & IBRD countries)European UnionFaroe IslandsFijiFinlandFranceGabonGambia, TheGeorgiaGermanyGhanaGreeceGrenadaGuatemalaGuineaGuinea-BissauGuyanaHeavily indebted poor countries (HIPC)High incomeHondurasHong Kong SAR, ChinaHungaryIcelandIDA blendIDA onlyIDA totalIndiaIndonesiaIran, Islamic Rep.IrelandItalyJamaicaJapanJordanKazakhstanKenyaKiribatiKorea, Rep.KosovoKuwaitKyrgyz RepublicLao PDRLatin America & Caribbean Latin America & Caribbean (excluding high income)Latin America & the Caribbean (IDA & IBRD countries)LatviaLeast developed countries: UN classificationLebanonLesothoLiberiaLibyaLiechtensteinLithuaniaLow incomeLower middle incomeLuxembourgMacao SAR, ChinaMacedonia, FYRMadagascarMalawiMalaysiaMaldivesMaliMaltaMarshall IslandsMauritaniaMauritiusMexicoMicronesia, Fed. Sts.Middle East & North Africa (excluding high income)Middle East & North Africa (IDA & IBRD countries)MoldovaMongoliaMontenegroMoroccoMozambiqueNamibiaNepalNetherlandsNew ZealandNicaraguaNigeriaNorth AmericaNorwayOECD membersOmanPacific island small statesPakistanPalauPanamaPapua New GuineaParaguayPeruPolandPortugalPost-demographic dividendPre-demographic dividendRomaniaRussian FederationRwandaSao Tome and PrincipeSenegalSerbiaSeychellesSierra LeoneSingaporeSlovak RepublicSloveniaSolomon IslandsSouth AfricaSouth AsiaSouth Asia (IDA & IBRD)SpainSri LankaSt. Kitts and NevisSt. LuciaSt. Vincent and the GrenadinesSub-Saharan Africa Sub-Saharan Africa (excluding high income)Sub-Saharan Africa (IDA & IBRD countries)SudanSurinameSwazilandSwedenSwitzerlandSyrian Arab RepublicTajikistanTanzaniaThailandTimor-LesteTongaTrinidad and TobagoTunisiaTurkeyTurkmenistanTuvaluUgandaUkraineUnited KingdomUnited StatesUruguayUzbekistanVanuatuVenezuela, RBVietnamWest Bank and GazaWorldYemen, Rep.ZambiaZimbabwe Timeline:
This timeline shows a graph from 1961 to 2016 of Madagascar. No data until 1960. Number of actual observations by date: 56.
Source name:
World Development Indicators
Source organization:
World Bank national accounts data, and OECD National Accounts data files.
Categories, topics:
Economy & Growth
Last updated:
apr 23, 2017
Indicators value changes by year
Minimum:
620.012 mln
jan 1, 1961
Maximum:
9.825 bln
jan 1, 2015
At the date of observation
Value
Absolute change
Change from previous value
jan 1, 1961
620.012 mln
+620.012 mln
0.0%
jan 1, 1962
644.067 mln
+24.055 mln
3.88%
jan 1, 1963
679.331 mln
+35.264 mln
5.48%
jan 1, 1964
692.908 mln
+13.577 mln
2.0%
jan 1, 1965
729.563 mln
+36.655 mln
5.29%
jan 1, 1966
753.757 mln
+24.194 mln
3.32%
jan 1, 1967
816.002 mln
+62.245 mln
8.26%
jan 1, 1968
868.933 mln
+52.931 mln
6.49%
jan 1, 1969
929.177 mln
+60.244 mln
6.93%
jan 1, 1970
945.111 mln
+15.933 mln
1.71%
jan 1, 1971
994.828 mln
+49.718 mln
5.26%
jan 1, 1972
1.062 bln
+66.836 mln
6.72%
jan 1, 1973
1.196 bln
+134.701 mln
12.69%
jan 1, 1974
1.474 bln
+277.68 mln
23.21%
jan 1, 1975
1.71 bln
+235.734 mln
15.99%
jan 1, 1976
2.036 bln
+325.961 mln
19.06%
jan 1, 1977
1.944 bln
-92.027 mln
-4.52%
jan 1, 1978
2.108 bln
+164.07 mln
8.44%
jan 1, 1979
2.359 bln
+251.313 mln
11.92%
jan 1, 1980
3.069 bln
+710.051 mln
30.1%
jan 1, 1981
3.588 bln
+518.97 mln
16.91%
jan 1, 1982
3.191 bln
-397.034 mln
-11.07%
jan 1, 1983
3.13 bln
-60.948 mln
-1.91%
jan 1, 1984
3.117 bln
-12.991 mln
-0.42%
jan 1, 1985
2.609 bln
-507.819 mln
-16.29%
jan 1, 1986
2.546 bln
-63.453 mln
-2.43%
jan 1, 1987
2.932 bln
+386.095 mln
15.17%
jan 1, 1988
2.239 bln
-693.216 mln
-23.64%
jan 1, 1989
2.166 bln
-72.704 mln
-3.25%
jan 1, 1990
2.273 bln
+107.052 mln
4.94%
jan 1, 1991
2.811 bln
+538.253 mln
23.68%
jan 1, 1992
2.492 bln
-319.818 mln
-11.38%
jan 1, 1993
2.78 bln
+288.816 mln
11.59%
jan 1, 1994
3.144 bln
+363.397 mln
13.07%
jan 1, 1995
2.794 bln
-349.361 mln
-11.11%
jan 1, 1996
2.936 bln
+142.049 mln
5.08%
jan 1, 1997
3.72 bln
+783.746 mln
26.69%
jan 1, 1998
3.279 bln
-441.28 mln
-11.86%
jan 1, 1999
3.438 bln
+158.789 mln
4.84%
jan 1, 2000
3.374 bln
-63.48 mln
-1.85%
jan 1, 2001
3.513 bln
+139.28 mln
4.13%
jan 1, 2002
4.179 bln
+665.185 mln
18.93%
jan 1, 2003
4.141 bln
-37.484 mln
-0.9%
jan 1, 2004
5.018 bln
+877.152 mln
21.18%
jan 1, 2005
3.967 bln
-1.051 bln
-20.95%
jan 1, 2006
4.575 bln
+607.441 mln
15.31%
jan 1, 2007
5.043 bln
+468.838 mln
10.25%
jan 1, 2008
6.687 bln
+1.644 bln
32.59%
jan 1, 2009
8.459 bln
+1.772 bln
26.49%
jan 1, 2010
7.876 bln
-582.689 mln
-6.89%
jan 1, 2011
8.017 bln
+140.708 mln
1.79%
jan 1, 2012
9.053 bln
+1.036 bln
12.93%
jan 1, 2013
9.066 bln
+13.392 mln
0.15%
jan 1, 2014
9.748 bln
+682.05 mln
7.52%
jan 1, 2015
9.825 bln
+76.451 mln
0.78%
jan 1, 2016
8.953 bln
-871.986 mln
-8.88%
Ranking of countries by current statistics by years


Comments: