29
/
en
AIzaSyAYiBZKx7MnpbEhh9jyipgxe19OcubqV5w
April 1, 2024
43483
Latin America & the Caribbean (IDA & IBRD countries)
TLA
false
2
1
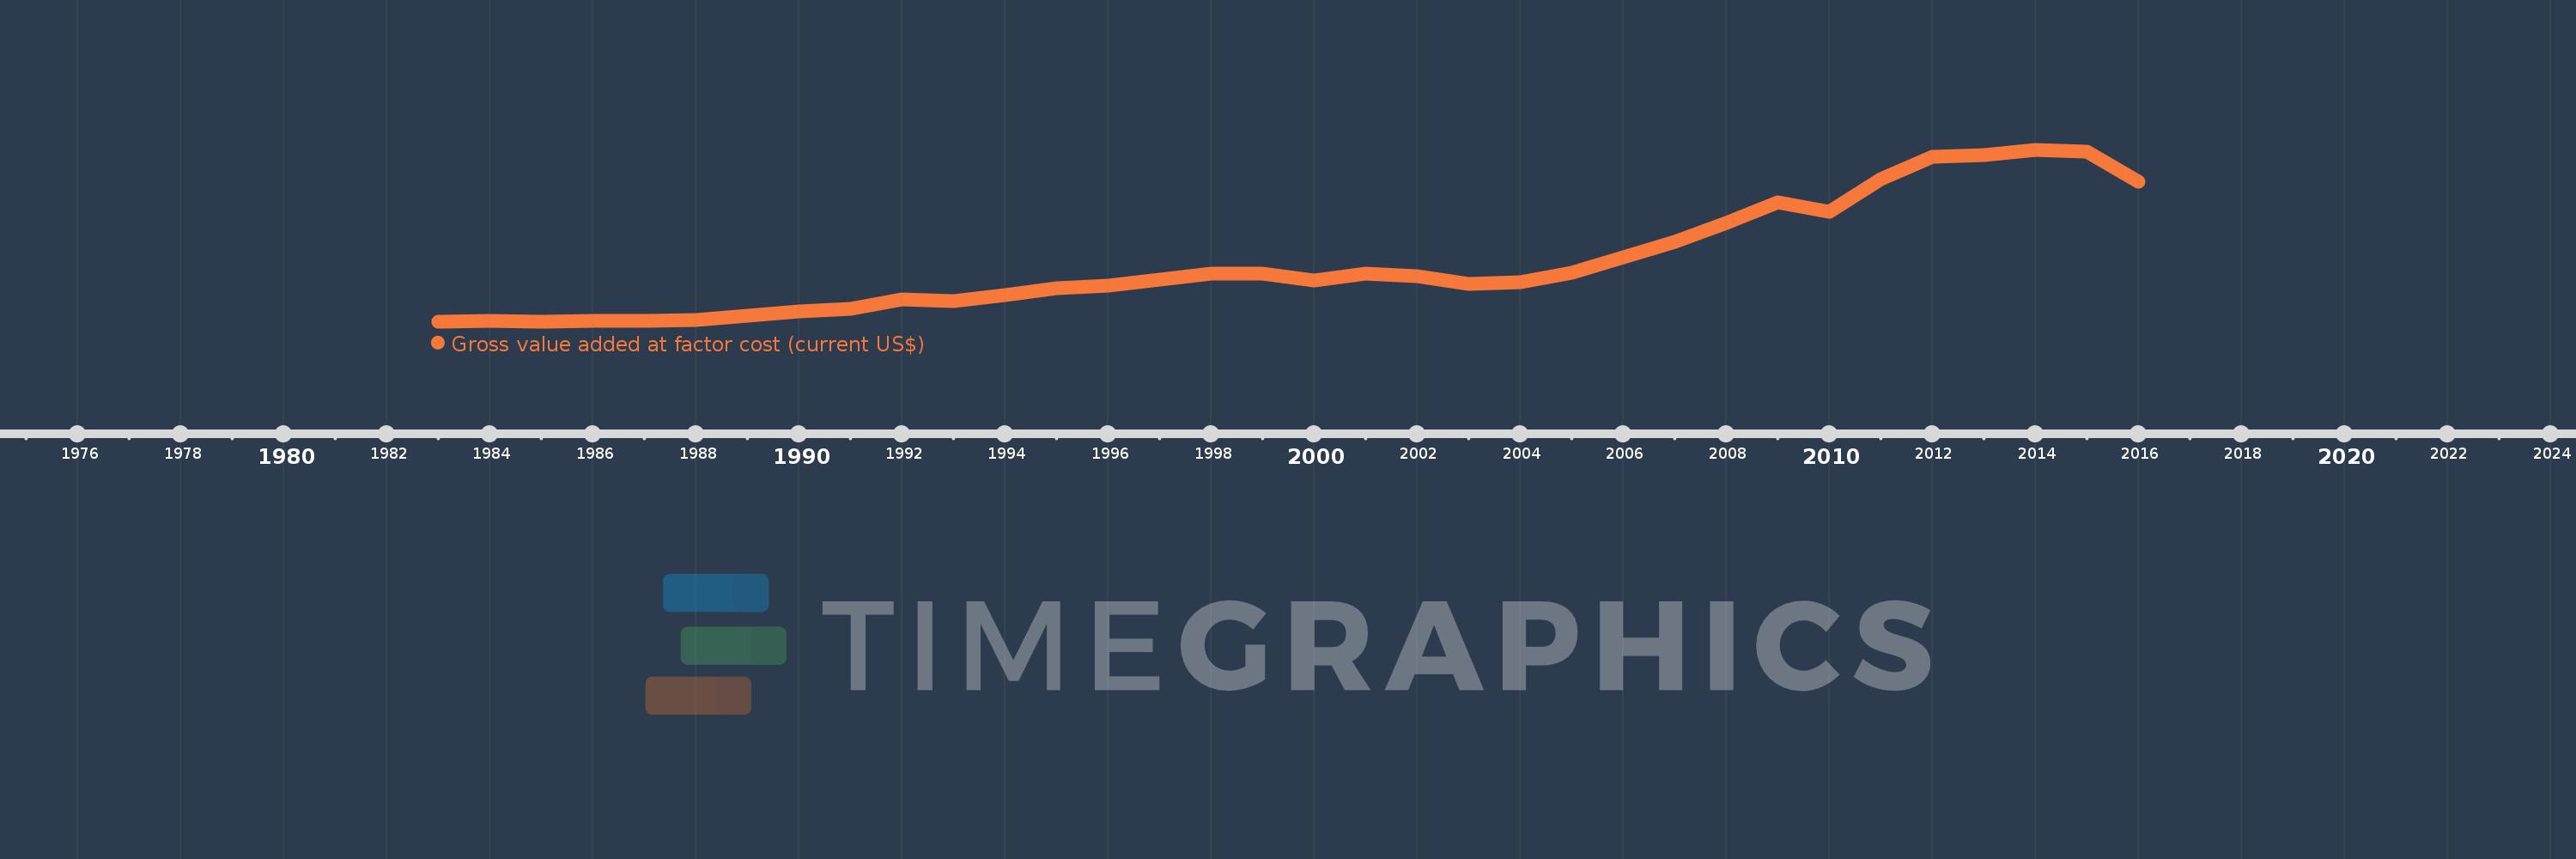
Gross value added at factor cost (current US$)
2016,2015,2014,2013,2012,2011,2010,2009,2008,2007,2006,2005,2004,2003,2002,2001,2000,1999,1998,1997,1996,1995,1994,1993,1992,1991,1990,1989,1988,1987,1986,1985,1984,1983
This statistics in other country:
AfghanistanAlbaniaAlgeriaAndorraAntigua and BarbudaArgentinaArmeniaArubaAustraliaAustriaAzerbaijanBahamas, TheBahrainBangladeshBarbadosBelarusBelgiumBelizeBeninBermudaBhutanBoliviaBosnia and HerzegovinaBotswanaBrazilBulgariaBurkina FasoBurundiCabo VerdeCambodiaCameroonCanadaCaribbean small statesCayman IslandsCentral African RepublicCentral Europe and the BalticsChadChileColombiaCongo, Dem. Rep.Costa RicaCroatiaCubaCyprusCzech RepublicDenmarkDjiboutiDominicaDominican RepublicEarly-demographic dividendEcuadorEgypt, Arab Rep.El SalvadorEquatorial GuineaEritreaEstoniaEthiopiaEuro areaEurope & Central AsiaEurope & Central Asia (excluding high income)Europe & Central Asia (IDA & IBRD countries)European UnionFaroe IslandsFijiFinlandFranceGabonGambia, TheGeorgiaGermanyGhanaGreeceGrenadaGuatemalaGuineaGuinea-BissauGuyanaHeavily indebted poor countries (HIPC)High incomeHondurasHong Kong SAR, ChinaHungaryIcelandIDA blendIDA onlyIDA totalIndiaIndonesiaIran, Islamic Rep.IrelandItalyJamaicaJapanJordanKazakhstanKenyaKiribatiKorea, Rep.KosovoKuwaitKyrgyz RepublicLao PDRLatin America & Caribbean Latin America & Caribbean (excluding high income)Latin America & the Caribbean (IDA & IBRD countries)LatviaLeast developed countries: UN classificationLebanonLesothoLiberiaLibyaLiechtensteinLithuaniaLow incomeLower middle incomeLuxembourgMacao SAR, ChinaMacedonia, FYRMadagascarMalawiMalaysiaMaldivesMaliMaltaMarshall IslandsMauritaniaMauritiusMexicoMicronesia, Fed. Sts.Middle East & North Africa (excluding high income)Middle East & North Africa (IDA & IBRD countries)MoldovaMongoliaMontenegroMoroccoMozambiqueNamibiaNepalNetherlandsNew ZealandNicaraguaNigeriaNorth AmericaNorwayOECD membersOmanPacific island small statesPakistanPalauPanamaPapua New GuineaParaguayPeruPolandPortugalPost-demographic dividendPre-demographic dividendRomaniaRussian FederationRwandaSao Tome and PrincipeSenegalSerbiaSeychellesSierra LeoneSingaporeSlovak RepublicSloveniaSolomon IslandsSouth AfricaSouth AsiaSouth Asia (IDA & IBRD)SpainSri LankaSt. Kitts and NevisSt. LuciaSt. Vincent and the GrenadinesSub-Saharan Africa Sub-Saharan Africa (excluding high income)Sub-Saharan Africa (IDA & IBRD countries)SudanSurinameSwazilandSwedenSwitzerlandSyrian Arab RepublicTajikistanTanzaniaThailandTimor-LesteTongaTrinidad and TobagoTunisiaTurkeyTurkmenistanTuvaluUgandaUkraineUnited KingdomUnited StatesUruguayUzbekistanVanuatuVenezuela, RBVietnamWest Bank and GazaWorldYemen, Rep.ZambiaZimbabwe Timeline:
This timeline shows a graph from 1983 to 2016 of Latin America & the Caribbean (IDA & IBRD countries). No data until 1982. Number of actual observations by date: 34.
Source name:
World Development Indicators
Source organization:
World Bank national accounts data, and OECD National Accounts data files.
Categories, topics:
Economy & Growth
Last updated:
apr 23, 2017
Indicators value changes by year
Minimum:
623.913 bln
jan 1, 1985
Maximum:
5.403 trl
jan 1, 2014
At the date of observation
Value
Absolute change
Change from previous value
jan 1, 1983
636.927 bln
+636.927 bln
0.0%
jan 1, 1984
655.988 bln
+19.062 bln
2.99%
jan 1, 1985
623.913 bln
-32.075 bln
-4.89%
jan 1, 1986
646.452 bln
+22.539 bln
3.61%
jan 1, 1987
661.667 bln
+15.214 bln
2.35%
jan 1, 1988
688.405 bln
+26.738 bln
4.04%
jan 1, 1989
804.867 bln
+116.462 bln
16.92%
jan 1, 1990
909.672 bln
+104.805 bln
13.02%
jan 1, 1991
997.368 bln
+87.696 bln
9.64%
jan 1, 1992
1.254 trl
+256.673 bln
25.74%
jan 1, 1993
1.193 trl
-61.17 bln
-4.88%
jan 1, 1994
1.381 trl
+188.538 bln
15.81%
jan 1, 1995
1.568 trl
+186.221 bln
13.48%
jan 1, 1996
1.64 trl
+72.451 bln
4.62%
jan 1, 1997
1.797 trl
+156.865 bln
9.56%
jan 1, 1998
1.969 trl
+171.748 bln
9.56%
jan 1, 1999
1.975 trl
+6.153 bln
0.31%
jan 1, 2000
1.77 trl
-204.445 bln
-10.35%
jan 1, 2001
1.966 trl
+195.143 bln
11.02%
jan 1, 2002
1.906 trl
-59.531 bln
-3.03%
jan 1, 2003
1.694 trl
-212.11 bln
-11.13%
jan 1, 2004
1.742 trl
+47.812 bln
2.82%
jan 1, 2005
2.001 trl
+259.636 bln
14.91%
jan 1, 2006
2.434 trl
+432.938 bln
21.63%
jan 1, 2007
2.863 trl
+428.786 bln
17.61%
jan 1, 2008
3.384 trl
+520.602 bln
18.18%
jan 1, 2009
3.947 trl
+563.048 bln
16.64%
jan 1, 2010
3.686 trl
-260.293 bln
-6.6%
jan 1, 2011
4.586 trl
+899.766 bln
24.41%
jan 1, 2012
5.22 trl
+634.148 bln
13.83%
jan 1, 2013
5.271 trl
+50.97 bln
0.98%
jan 1, 2014
5.403 trl
+132.164 bln
2.51%
jan 1, 2015
5.371 trl
-32.792 bln
-0.61%
jan 1, 2016
4.537 trl
-833.827 bln
-15.53%
Ranking of countries by current statistics by years


Comments: