29
/
en
AIzaSyAYiBZKx7MnpbEhh9jyipgxe19OcubqV5w
April 1, 2024
100001
Cameroon
CMR
true
2
1
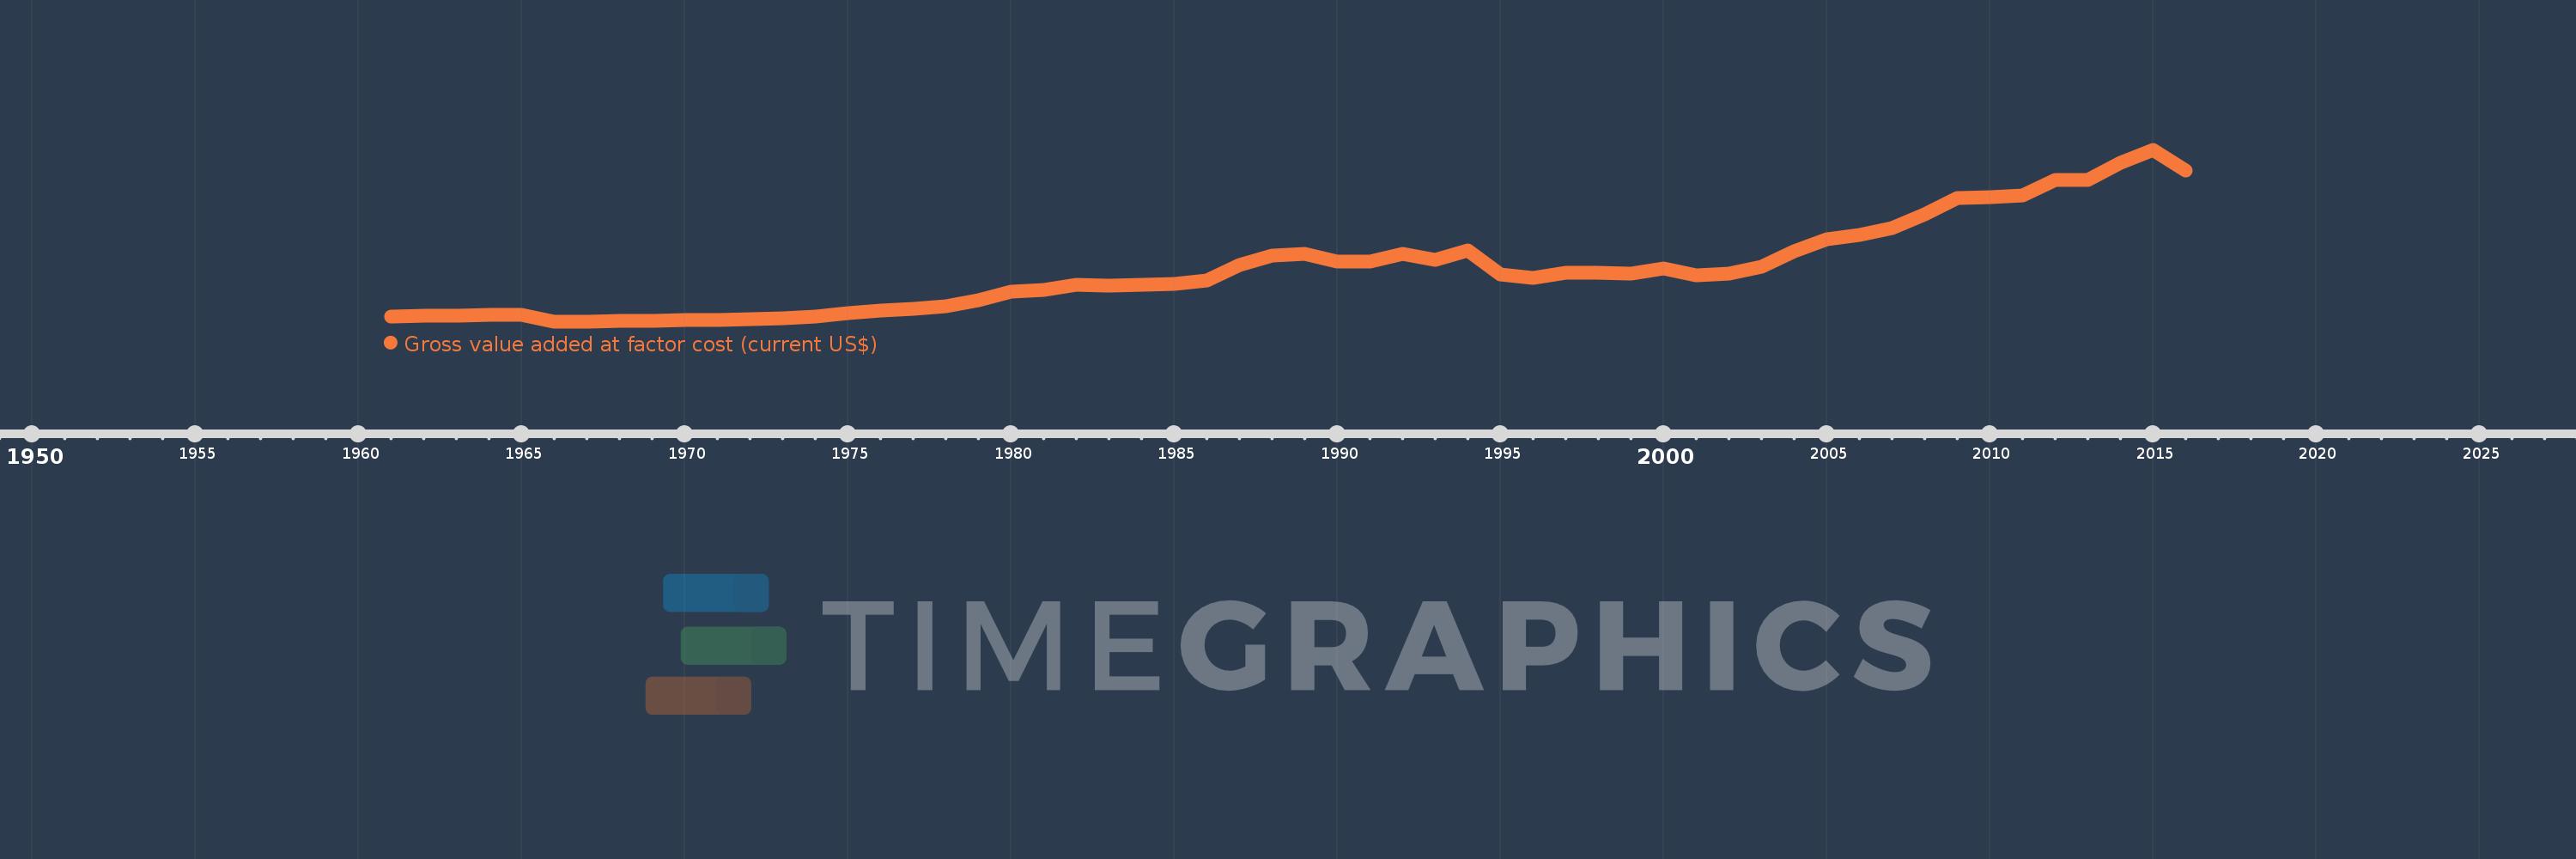
Gross value added at factor cost (current US$)
2016,2015,2014,2013,2012,2011,2010,2009,2008,2007,2006,2005,2004,2003,2002,2001,2000,1999,1998,1997,1996,1995,1994,1993,1992,1991,1990,1989,1988,1987,1986,1985,1984,1983,1982,1981,1980,1979,1978,1977,1976,1975,1974,1973,1972,1971,1970,1969,1968,1967,1966,1965,1964,1963,1962,1961
This statistics in other country:
AfghanistanAlbaniaAlgeriaAndorraAntigua and BarbudaArgentinaArmeniaArubaAustraliaAustriaAzerbaijanBahamas, TheBahrainBangladeshBarbadosBelarusBelgiumBelizeBeninBermudaBhutanBoliviaBosnia and HerzegovinaBotswanaBrazilBulgariaBurkina FasoBurundiCabo VerdeCambodiaCameroonCanadaCaribbean small statesCayman IslandsCentral African RepublicCentral Europe and the BalticsChadChileColombiaCongo, Dem. Rep.Costa RicaCroatiaCubaCyprusCzech RepublicDenmarkDjiboutiDominicaDominican RepublicEarly-demographic dividendEcuadorEgypt, Arab Rep.El SalvadorEquatorial GuineaEritreaEstoniaEthiopiaEuro areaEurope & Central AsiaEurope & Central Asia (excluding high income)Europe & Central Asia (IDA & IBRD countries)European UnionFaroe IslandsFijiFinlandFranceGabonGambia, TheGeorgiaGermanyGhanaGreeceGrenadaGuatemalaGuineaGuinea-BissauGuyanaHeavily indebted poor countries (HIPC)High incomeHondurasHong Kong SAR, ChinaHungaryIcelandIDA blendIDA onlyIDA totalIndiaIndonesiaIran, Islamic Rep.IrelandItalyJamaicaJapanJordanKazakhstanKenyaKiribatiKorea, Rep.KosovoKuwaitKyrgyz RepublicLao PDRLatin America & Caribbean Latin America & Caribbean (excluding high income)Latin America & the Caribbean (IDA & IBRD countries)LatviaLeast developed countries: UN classificationLebanonLesothoLiberiaLibyaLiechtensteinLithuaniaLow incomeLower middle incomeLuxembourgMacao SAR, ChinaMacedonia, FYRMadagascarMalawiMalaysiaMaldivesMaliMaltaMarshall IslandsMauritaniaMauritiusMexicoMicronesia, Fed. Sts.Middle East & North Africa (excluding high income)Middle East & North Africa (IDA & IBRD countries)MoldovaMongoliaMontenegroMoroccoMozambiqueNamibiaNepalNetherlandsNew ZealandNicaraguaNigeriaNorth AmericaNorwayOECD membersOmanPacific island small statesPakistanPalauPanamaPapua New GuineaParaguayPeruPolandPortugalPost-demographic dividendPre-demographic dividendRomaniaRussian FederationRwandaSao Tome and PrincipeSenegalSerbiaSeychellesSierra LeoneSingaporeSlovak RepublicSloveniaSolomon IslandsSouth AfricaSouth AsiaSouth Asia (IDA & IBRD)SpainSri LankaSt. Kitts and NevisSt. LuciaSt. Vincent and the GrenadinesSub-Saharan Africa Sub-Saharan Africa (excluding high income)Sub-Saharan Africa (IDA & IBRD countries)SudanSurinameSwazilandSwedenSwitzerlandSyrian Arab RepublicTajikistanTanzaniaThailandTimor-LesteTongaTrinidad and TobagoTunisiaTurkeyTurkmenistanTuvaluUgandaUkraineUnited KingdomUnited StatesUruguayUzbekistanVanuatuVenezuela, RBVietnamWest Bank and GazaWorldYemen, Rep.ZambiaZimbabwe Timeline:
This timeline shows a graph from 1961 to 2016 of Cameroon. No data until 1960. Number of actual observations by date: 56.
Source name:
World Development Indicators
Source organization:
World Bank national accounts data, and OECD National Accounts data files.
Categories, topics:
Economy & Growth
Last updated:
apr 23, 2017
Indicators value changes by year
Minimum:
814.14 mln
jan 1, 1966
Maximum:
29.461 bln
jan 1, 2015
At the date of observation
Value
Absolute change
Change from previous value
jan 1, 1961
1.693 bln
+1.693 bln
0.0%
jan 1, 1962
1.796 bln
+102.523 mln
6.06%
jan 1, 1963
1.912 bln
+116.728 mln
6.5%
jan 1, 1964
1.942 bln
+29.6 mln
1.55%
jan 1, 1965
2.059 bln
+117.202 mln
6.04%
jan 1, 1966
814.14 mln
-1.245 bln
-60.46%
jan 1, 1967
853.269 mln
+39.129 mln
4.81%
jan 1, 1968
934.079 mln
+80.81 mln
9.47%
jan 1, 1969
1.053 bln
+118.998 mln
12.74%
jan 1, 1970
1.152 bln
+99.341 mln
9.43%
jan 1, 1971
1.16 bln
+7.584 mln
0.66%
jan 1, 1972
1.234 bln
+73.99 mln
6.38%
jan 1, 1973
1.431 bln
+196.956 mln
15.96%
jan 1, 1974
1.759 bln
+327.779 mln
22.91%
jan 1, 1975
2.255 bln
+496.77 mln
28.25%
jan 1, 1976
2.753 bln
+497.274 mln
22.05%
jan 1, 1977
3.077 bln
+323.821 mln
11.76%
jan 1, 1978
3.366 bln
+289.776 mln
9.42%
jan 1, 1979
4.41 bln
+1.044 bln
31.0%
jan 1, 1980
5.811 bln
+1.402 bln
31.78%
jan 1, 1981
6.181 bln
+369.908 mln
6.37%
jan 1, 1982
7.059 bln
+878.101 mln
14.21%
jan 1, 1983
6.9 bln
-159.229 mln
-2.26%
jan 1, 1984
7.042 bln
+142.144 mln
2.06%
jan 1, 1985
7.212 bln
+169.65 mln
2.41%
jan 1, 1986
7.778 bln
+566.03 mln
7.85%
jan 1, 1987
10.273 bln
+2.494 bln
32.07%
jan 1, 1988
11.891 bln
+1.619 bln
15.76%
jan 1, 1989
12.128 bln
+236.965 mln
1.99%
jan 1, 1990
10.882 bln
-1.246 bln
-10.28%
jan 1, 1991
10.888 bln
+6.197 mln
0.06%
jan 1, 1992
12.166 bln
+1.277 bln
11.73%
jan 1, 1993
11.107 bln
-1.059 bln
-8.7%
jan 1, 1994
12.794 bln
+1.687 bln
15.19%
jan 1, 1995
8.664 bln
-4.13 bln
-32.28%
jan 1, 1996
8.118 bln
-546.07 mln
-6.3%
jan 1, 1997
9.024 bln
+905.768 mln
11.16%
jan 1, 1998
9.091 bln
+67.336 mln
0.75%
jan 1, 1999
8.895 bln
-196.211 mln
-2.16%
jan 1, 2000
9.716 bln
+821.326 mln
9.23%
jan 1, 2001
8.588 bln
-1.128 bln
-11.61%
jan 1, 2002
8.884 bln
+295.498 mln
3.44%
jan 1, 2003
10.05 bln
+1.167 bln
13.13%
jan 1, 2004
12.611 bln
+2.561 bln
25.48%
jan 1, 2005
14.653 bln
+2.042 bln
16.19%
jan 1, 2006
15.333 bln
+679.424 mln
4.64%
jan 1, 2007
16.527 bln
+1.194 bln
7.79%
jan 1, 2008
18.822 bln
+2.295 bln
13.89%
jan 1, 2009
21.511 bln
+2.689 bln
14.29%
jan 1, 2010
21.569 bln
+58.49 mln
0.27%
jan 1, 2011
21.878 bln
+308.738 mln
1.43%
jan 1, 2012
24.525 bln
+2.647 bln
12.1%
jan 1, 2013
24.454 bln
-70.68 mln
-0.29%
jan 1, 2014
27.321 bln
+2.867 bln
11.72%
jan 1, 2015
29.461 bln
+2.14 bln
7.83%
jan 1, 2016
26.108 bln
-3.353 bln
-11.38%
Ranking of countries by current statistics by years


Comments: