29
/
en
AIzaSyAYiBZKx7MnpbEhh9jyipgxe19OcubqV5w
April 1, 2024
52664
OECD members
OED
false
2
1
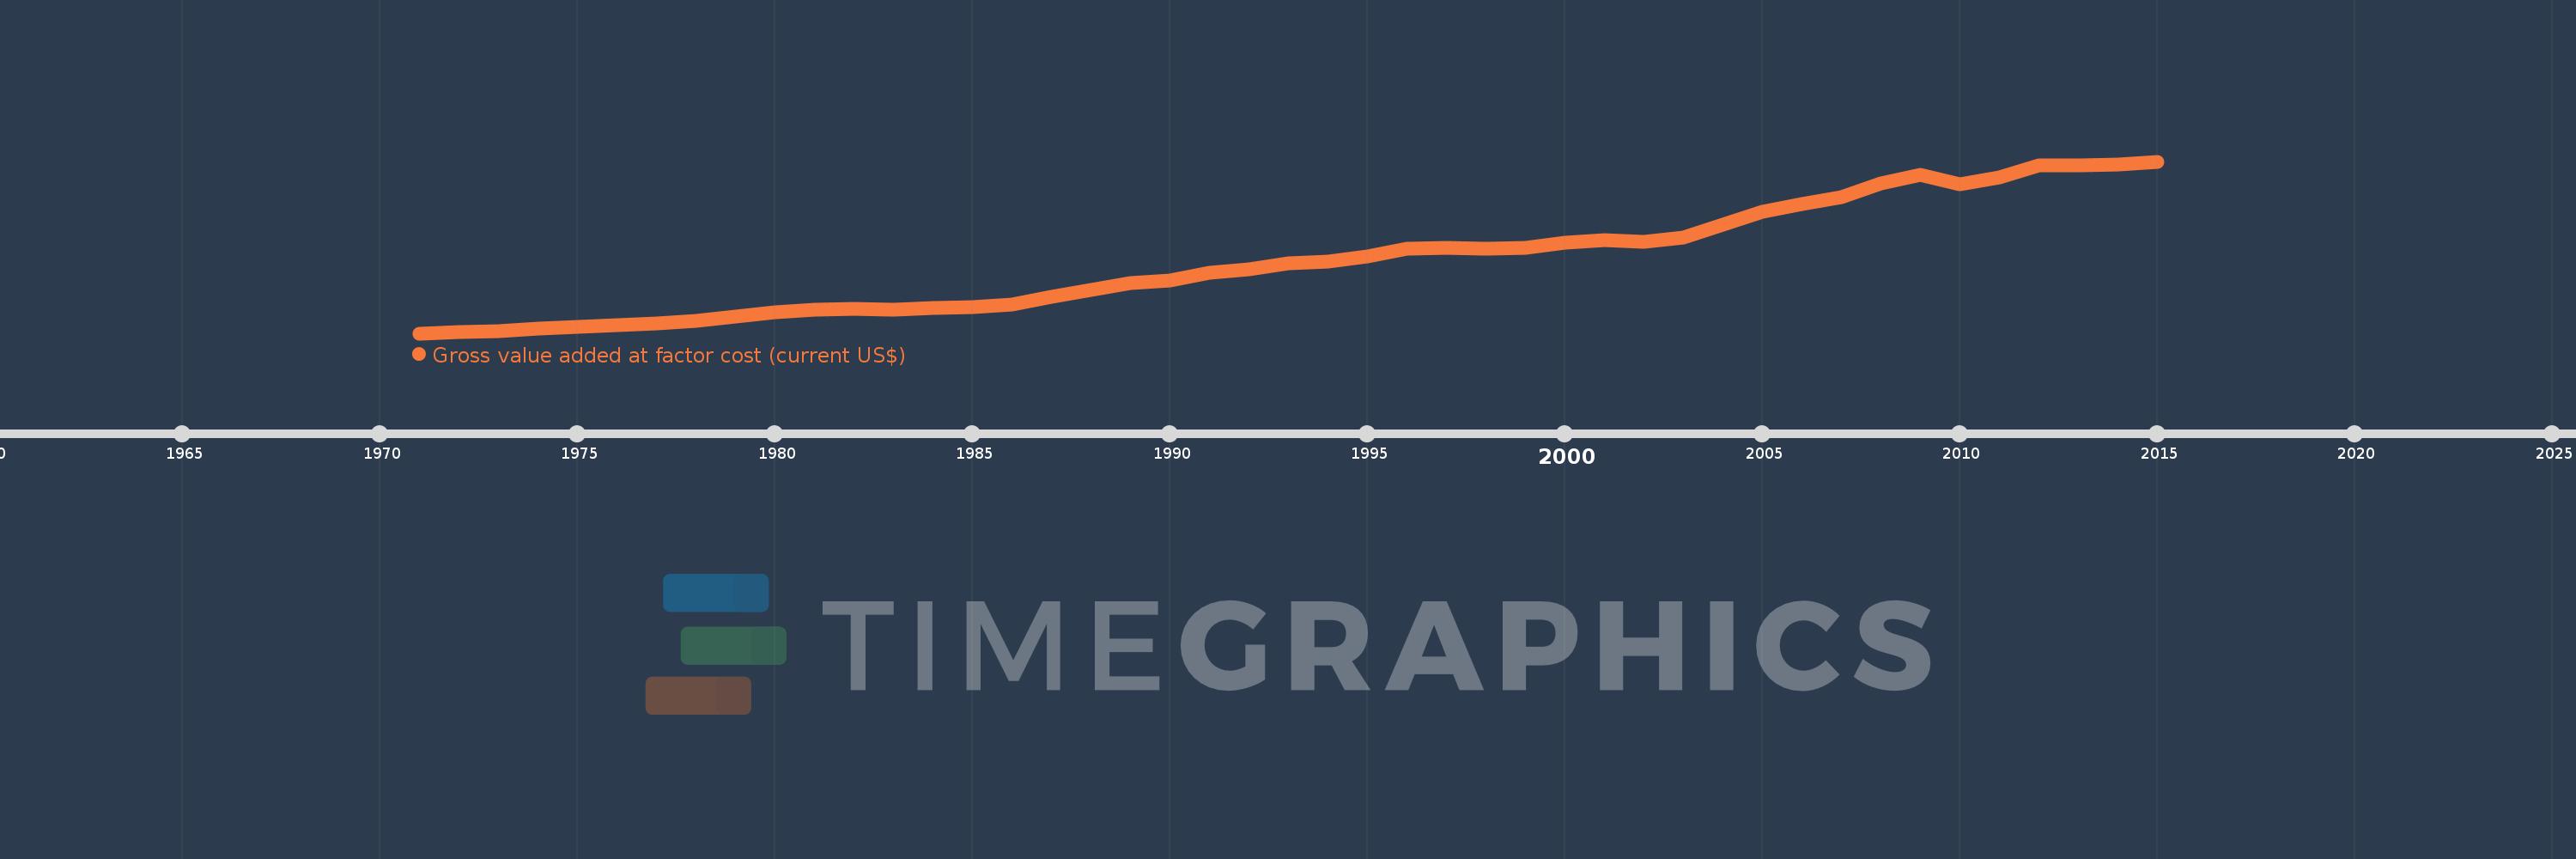
Gross value added at factor cost (current US$)
2015,2014,2013,2012,2011,2010,2009,2008,2007,2006,2005,2004,2003,2002,2001,2000,1999,1998,1997,1996,1995,1994,1993,1992,1991,1990,1989,1988,1987,1986,1985,1984,1983,1982,1981,1980,1979,1978,1977,1976,1975,1974,1973,1972,1971
This statistics in other country:
AfghanistanAlbaniaAlgeriaAndorraAntigua and BarbudaArgentinaArmeniaArubaAustraliaAustriaAzerbaijanBahamas, TheBahrainBangladeshBarbadosBelarusBelgiumBelizeBeninBermudaBhutanBoliviaBosnia and HerzegovinaBotswanaBrazilBulgariaBurkina FasoBurundiCabo VerdeCambodiaCameroonCanadaCaribbean small statesCayman IslandsCentral African RepublicCentral Europe and the BalticsChadChileColombiaCongo, Dem. Rep.Costa RicaCroatiaCubaCyprusCzech RepublicDenmarkDjiboutiDominicaDominican RepublicEarly-demographic dividendEcuadorEgypt, Arab Rep.El SalvadorEquatorial GuineaEritreaEstoniaEthiopiaEuro areaEurope & Central AsiaEurope & Central Asia (excluding high income)Europe & Central Asia (IDA & IBRD countries)European UnionFaroe IslandsFijiFinlandFranceGabonGambia, TheGeorgiaGermanyGhanaGreeceGrenadaGuatemalaGuineaGuinea-BissauGuyanaHeavily indebted poor countries (HIPC)High incomeHondurasHong Kong SAR, ChinaHungaryIcelandIDA blendIDA onlyIDA totalIndiaIndonesiaIran, Islamic Rep.IrelandItalyJamaicaJapanJordanKazakhstanKenyaKiribatiKorea, Rep.KosovoKuwaitKyrgyz RepublicLao PDRLatin America & Caribbean Latin America & Caribbean (excluding high income)Latin America & the Caribbean (IDA & IBRD countries)LatviaLeast developed countries: UN classificationLebanonLesothoLiberiaLibyaLiechtensteinLithuaniaLow incomeLower middle incomeLuxembourgMacao SAR, ChinaMacedonia, FYRMadagascarMalawiMalaysiaMaldivesMaliMaltaMarshall IslandsMauritaniaMauritiusMexicoMicronesia, Fed. Sts.Middle East & North Africa (excluding high income)Middle East & North Africa (IDA & IBRD countries)MoldovaMongoliaMontenegroMoroccoMozambiqueNamibiaNepalNetherlandsNew ZealandNicaraguaNigeriaNorth AmericaNorwayOECD membersOmanPacific island small statesPakistanPalauPanamaPapua New GuineaParaguayPeruPolandPortugalPost-demographic dividendPre-demographic dividendRomaniaRussian FederationRwandaSao Tome and PrincipeSenegalSerbiaSeychellesSierra LeoneSingaporeSlovak RepublicSloveniaSolomon IslandsSouth AfricaSouth AsiaSouth Asia (IDA & IBRD)SpainSri LankaSt. Kitts and NevisSt. LuciaSt. Vincent and the GrenadinesSub-Saharan Africa Sub-Saharan Africa (excluding high income)Sub-Saharan Africa (IDA & IBRD countries)SudanSurinameSwazilandSwedenSwitzerlandSyrian Arab RepublicTajikistanTanzaniaThailandTimor-LesteTongaTrinidad and TobagoTunisiaTurkeyTurkmenistanTuvaluUgandaUkraineUnited KingdomUnited StatesUruguayUzbekistanVanuatuVenezuela, RBVietnamWest Bank and GazaWorldYemen, Rep.ZambiaZimbabwe Timeline:
This timeline shows a graph from 1971 to 2015 of OECD members. No data until 1970. Number of actual observations by date: 45.
Source name:
World Development Indicators
Source organization:
World Bank national accounts data, and OECD National Accounts data files.
Categories, topics:
Economy & Growth
Last updated:
apr 23, 2017
Indicators value changes by year
Minimum:
2.218 trl
jan 1, 1971
Maximum:
45.636 trl
jan 1, 2015
At the date of observation
Value
Absolute change
Change from previous value
jan 1, 1971
2.218 trl
+2.218 trl
0.0%
jan 1, 1972
2.457 trl
+239.122 bln
10.78%
jan 1, 1973
2.862 trl
+404.547 bln
16.46%
jan 1, 1974
3.466 trl
+604.801 bln
21.13%
jan 1, 1975
3.895 trl
+428.055 bln
12.35%
jan 1, 1976
4.372 trl
+477.791 bln
12.27%
jan 1, 1977
4.738 trl
+365.379 bln
8.36%
jan 1, 1978
5.344 trl
+606.162 bln
12.79%
jan 1, 1979
6.437 trl
+1.093 trl
20.45%
jan 1, 1980
7.435 trl
+998.316 bln
15.51%
jan 1, 1981
8.247 trl
+811.643 bln
10.92%
jan 1, 1982
8.384 trl
+137.409 bln
1.67%
jan 1, 1983
8.254 trl
-129.88 bln
-1.55%
jan 1, 1984
8.533 trl
+278.616 bln
3.38%
jan 1, 1985
8.924 trl
+391.675 bln
4.59%
jan 1, 1986
9.406 trl
+481.974 bln
5.4%
jan 1, 1987
11.399 trl
+1.992 trl
21.18%
jan 1, 1988
13.201 trl
+1.802 trl
15.81%
jan 1, 1989
14.884 trl
+1.683 trl
12.75%
jan 1, 1990
15.568 trl
+684.229 bln
4.6%
jan 1, 1991
17.505 trl
+1.936 trl
12.44%
jan 1, 1992
18.487 trl
+982.096 bln
5.61%
jan 1, 1993
19.877 trl
+1.39 trl
7.52%
jan 1, 1994
20.253 trl
+376.395 bln
1.89%
jan 1, 1995
21.565 trl
+1.312 trl
6.48%
jan 1, 1996
23.592 trl
+2.027 trl
9.4%
jan 1, 1997
23.752 trl
+160.069 bln
0.68%
jan 1, 1998
23.677 trl
-74.878 bln
-0.32%
jan 1, 1999
23.87 trl
+192.738 bln
0.81%
jan 1, 2000
25.117 trl
+1.247 trl
5.23%
jan 1, 2001
25.678 trl
+561.102 bln
2.23%
jan 1, 2002
25.44 trl
-238.108 bln
-0.93%
jan 1, 2003
26.517 trl
+1.078 trl
4.24%
jan 1, 2004
29.651 trl
+3.133 trl
11.82%
jan 1, 2005
32.949 trl
+3.299 trl
11.12%
jan 1, 2006
34.79 trl
+1.841 trl
5.59%
jan 1, 2007
36.631 trl
+1.841 trl
5.29%
jan 1, 2008
40.005 trl
+3.373 trl
9.21%
jan 1, 2009
42.373 trl
+2.369 trl
5.92%
jan 1, 2010
39.79 trl
-2.583 trl
-6.1%
jan 1, 2011
41.609 trl
+1.819 trl
4.57%
jan 1, 2012
44.611 trl
+3.002 trl
7.22%
jan 1, 2013
44.576 trl
-35.405 bln
-0.08%
jan 1, 2014
44.878 trl
+302.568 bln
0.68%
jan 1, 2015
45.636 trl
+757.783 bln
1.69%
Ranking of countries by current statistics by years


Comments: