29
/
en
AIzaSyAYiBZKx7MnpbEhh9jyipgxe19OcubqV5w
April 1, 2024
31642
Europe & Central Asia (excluding high income)
ECA
false
2
1
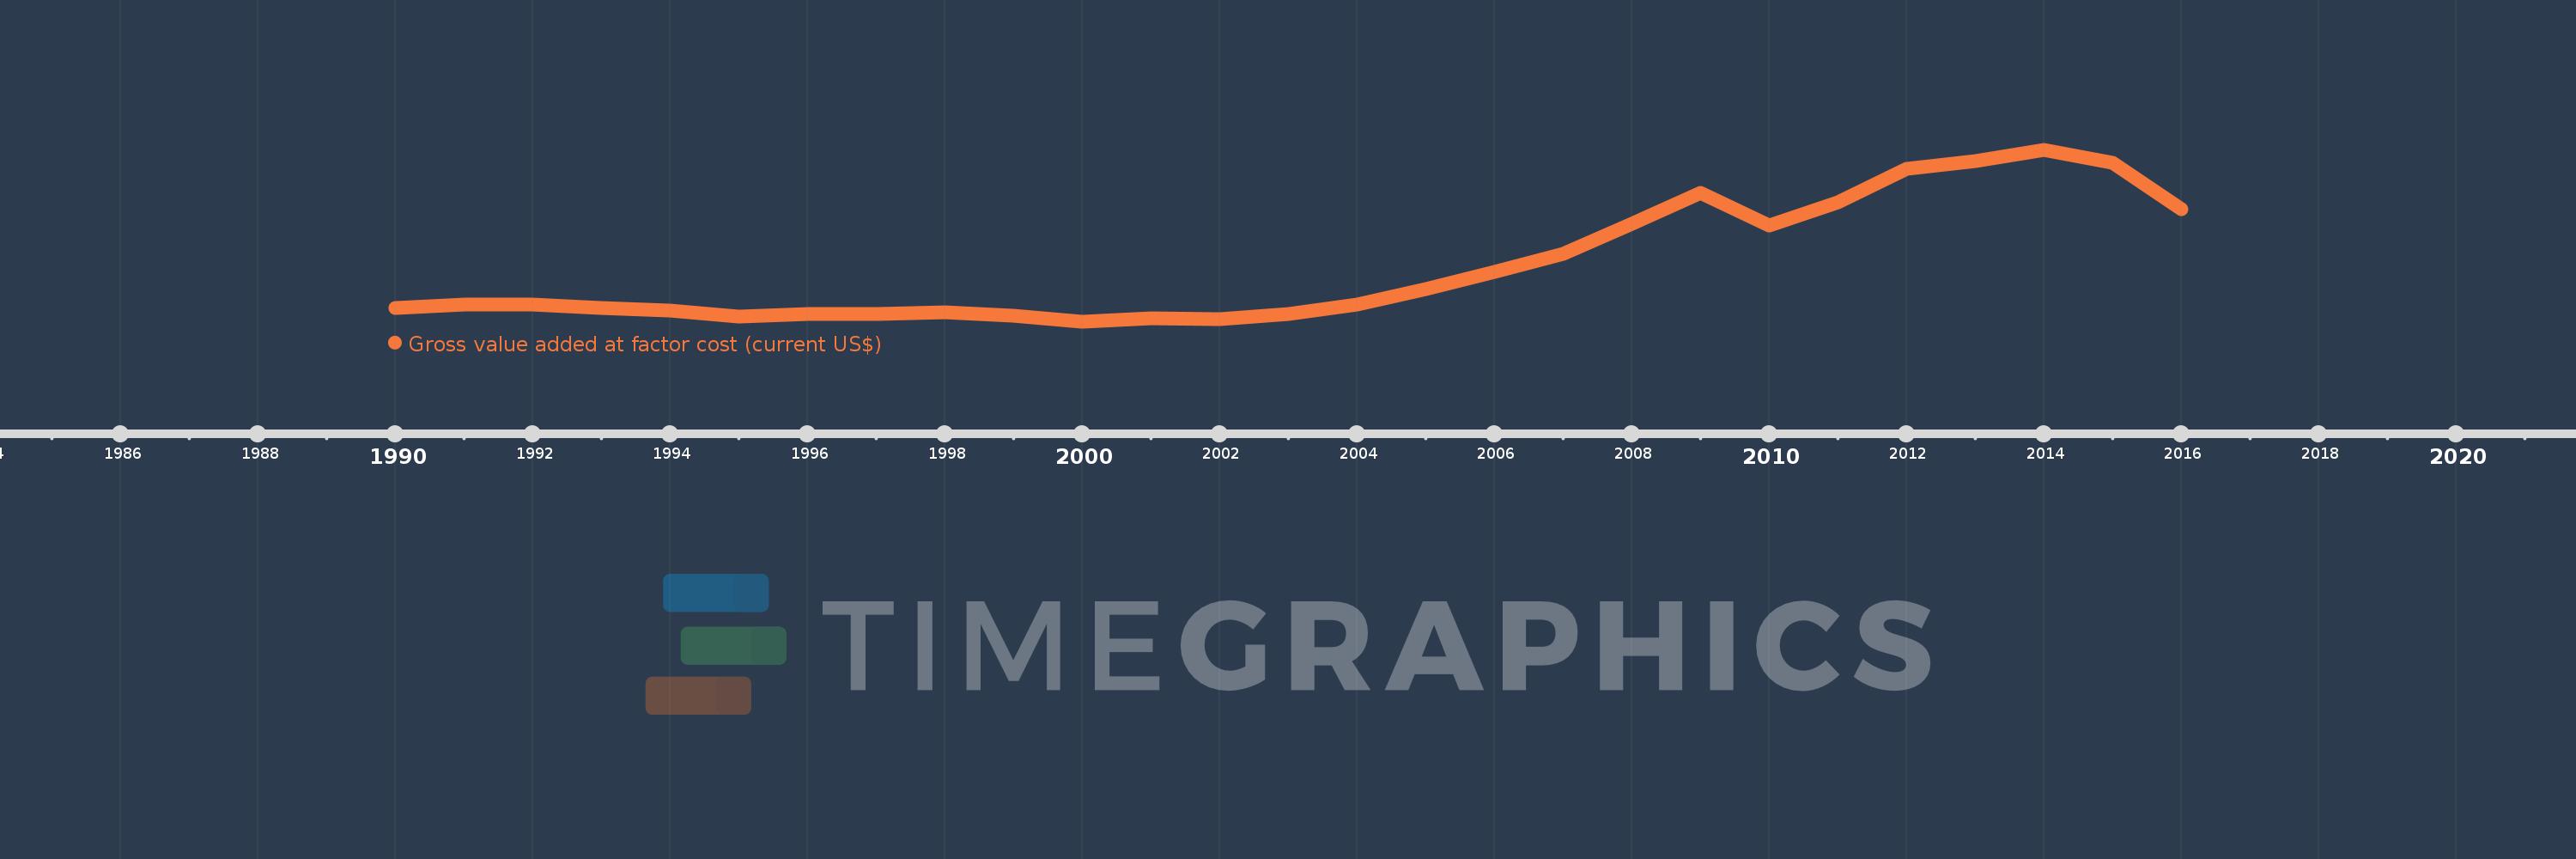
Gross value added at factor cost (current US$)
2016,2015,2014,2013,2012,2011,2010,2009,2008,2007,2006,2005,2004,2003,2002,2001,2000,1999,1998,1997,1996,1995,1994,1993,1992,1991,1990
This statistics in other country:
AfghanistanAlbaniaAlgeriaAndorraAntigua and BarbudaArgentinaArmeniaArubaAustraliaAustriaAzerbaijanBahamas, TheBahrainBangladeshBarbadosBelarusBelgiumBelizeBeninBermudaBhutanBoliviaBosnia and HerzegovinaBotswanaBrazilBulgariaBurkina FasoBurundiCabo VerdeCambodiaCameroonCanadaCaribbean small statesCayman IslandsCentral African RepublicCentral Europe and the BalticsChadChileColombiaCongo, Dem. Rep.Costa RicaCroatiaCubaCyprusCzech RepublicDenmarkDjiboutiDominicaDominican RepublicEarly-demographic dividendEcuadorEgypt, Arab Rep.El SalvadorEquatorial GuineaEritreaEstoniaEthiopiaEuro areaEurope & Central AsiaEurope & Central Asia (excluding high income)Europe & Central Asia (IDA & IBRD countries)European UnionFaroe IslandsFijiFinlandFranceGabonGambia, TheGeorgiaGermanyGhanaGreeceGrenadaGuatemalaGuineaGuinea-BissauGuyanaHeavily indebted poor countries (HIPC)High incomeHondurasHong Kong SAR, ChinaHungaryIcelandIDA blendIDA onlyIDA totalIndiaIndonesiaIran, Islamic Rep.IrelandItalyJamaicaJapanJordanKazakhstanKenyaKiribatiKorea, Rep.KosovoKuwaitKyrgyz RepublicLao PDRLatin America & Caribbean Latin America & Caribbean (excluding high income)Latin America & the Caribbean (IDA & IBRD countries)LatviaLeast developed countries: UN classificationLebanonLesothoLiberiaLibyaLiechtensteinLithuaniaLow incomeLower middle incomeLuxembourgMacao SAR, ChinaMacedonia, FYRMadagascarMalawiMalaysiaMaldivesMaliMaltaMarshall IslandsMauritaniaMauritiusMexicoMicronesia, Fed. Sts.Middle East & North Africa (excluding high income)Middle East & North Africa (IDA & IBRD countries)MoldovaMongoliaMontenegroMoroccoMozambiqueNamibiaNepalNetherlandsNew ZealandNicaraguaNigeriaNorth AmericaNorwayOECD membersOmanPacific island small statesPakistanPalauPanamaPapua New GuineaParaguayPeruPolandPortugalPost-demographic dividendPre-demographic dividendRomaniaRussian FederationRwandaSao Tome and PrincipeSenegalSerbiaSeychellesSierra LeoneSingaporeSlovak RepublicSloveniaSolomon IslandsSouth AfricaSouth AsiaSouth Asia (IDA & IBRD)SpainSri LankaSt. Kitts and NevisSt. LuciaSt. Vincent and the GrenadinesSub-Saharan Africa Sub-Saharan Africa (excluding high income)Sub-Saharan Africa (IDA & IBRD countries)SudanSurinameSwazilandSwedenSwitzerlandSyrian Arab RepublicTajikistanTanzaniaThailandTimor-LesteTongaTrinidad and TobagoTunisiaTurkeyTurkmenistanTuvaluUgandaUkraineUnited KingdomUnited StatesUruguayUzbekistanVanuatuVenezuela, RBVietnamWest Bank and GazaWorldYemen, Rep.ZambiaZimbabwe Timeline:
This timeline shows a graph from 1990 to 2016 of Europe & Central Asia (excluding high income). No data until 1989. Number of actual observations by date: 27.
Source name:
World Development Indicators
Source organization:
World Bank national accounts data, and OECD National Accounts data files.
Categories, topics:
Economy & Growth
Last updated:
apr 23, 2017
Indicators value changes by year
Minimum:
558.271 bln
jan 1, 2000
Maximum:
3.607 trl
jan 1, 2014
At the date of observation
Value
Absolute change
Change from previous value
jan 1, 1990
805.586 bln
+805.586 bln
0.0%
jan 1, 1991
874.454 bln
+68.868 bln
8.55%
jan 1, 1992
868.465 bln
-5.988 bln
-0.68%
jan 1, 1993
807.428 bln
-61.037 bln
-7.03%
jan 1, 1994
756.777 bln
-50.651 bln
-6.27%
jan 1, 1995
655.85 bln
-100.927 bln
-13.34%
jan 1, 1996
706.588 bln
+50.738 bln
7.74%
jan 1, 1997
707.002 bln
+414.075 mln
0.06%
jan 1, 1998
734.201 bln
+27.199 bln
3.85%
jan 1, 1999
670.518 bln
-63.683 bln
-8.67%
jan 1, 2000
558.271 bln
-112.247 bln
-16.74%
jan 1, 2001
616.209 bln
+57.938 bln
10.38%
jan 1, 2002
613.66 bln
-2.549 bln
-0.41%
jan 1, 2003
695.849 bln
+82.189 bln
13.39%
jan 1, 2004
872.641 bln
+176.793 bln
25.41%
jan 1, 2005
1.149 trl
+276.708 bln
31.71%
jan 1, 2006
1.44 trl
+291.098 bln
25.33%
jan 1, 2007
1.774 trl
+333.262 bln
23.14%
jan 1, 2008
2.304 trl
+530.351 bln
29.9%
jan 1, 2009
2.848 trl
+543.81 bln
23.6%
jan 1, 2010
2.272 trl
-575.543 bln
-20.21%
jan 1, 2011
2.688 trl
+415.203 bln
18.27%
jan 1, 2012
3.277 trl
+589.4 bln
21.93%
jan 1, 2013
3.412 trl
+134.687 bln
4.11%
jan 1, 2014
3.607 trl
+195.329 bln
5.73%
jan 1, 2015
3.39 trl
-216.816 bln
-6.01%
jan 1, 2016
2.567 trl
-823.104 bln
-24.28%
Ranking of countries by current statistics by years


Comments: