29
/
en
AIzaSyAYiBZKx7MnpbEhh9jyipgxe19OcubqV5w
April 1, 2024
224929
Poland
POL
true
2
1
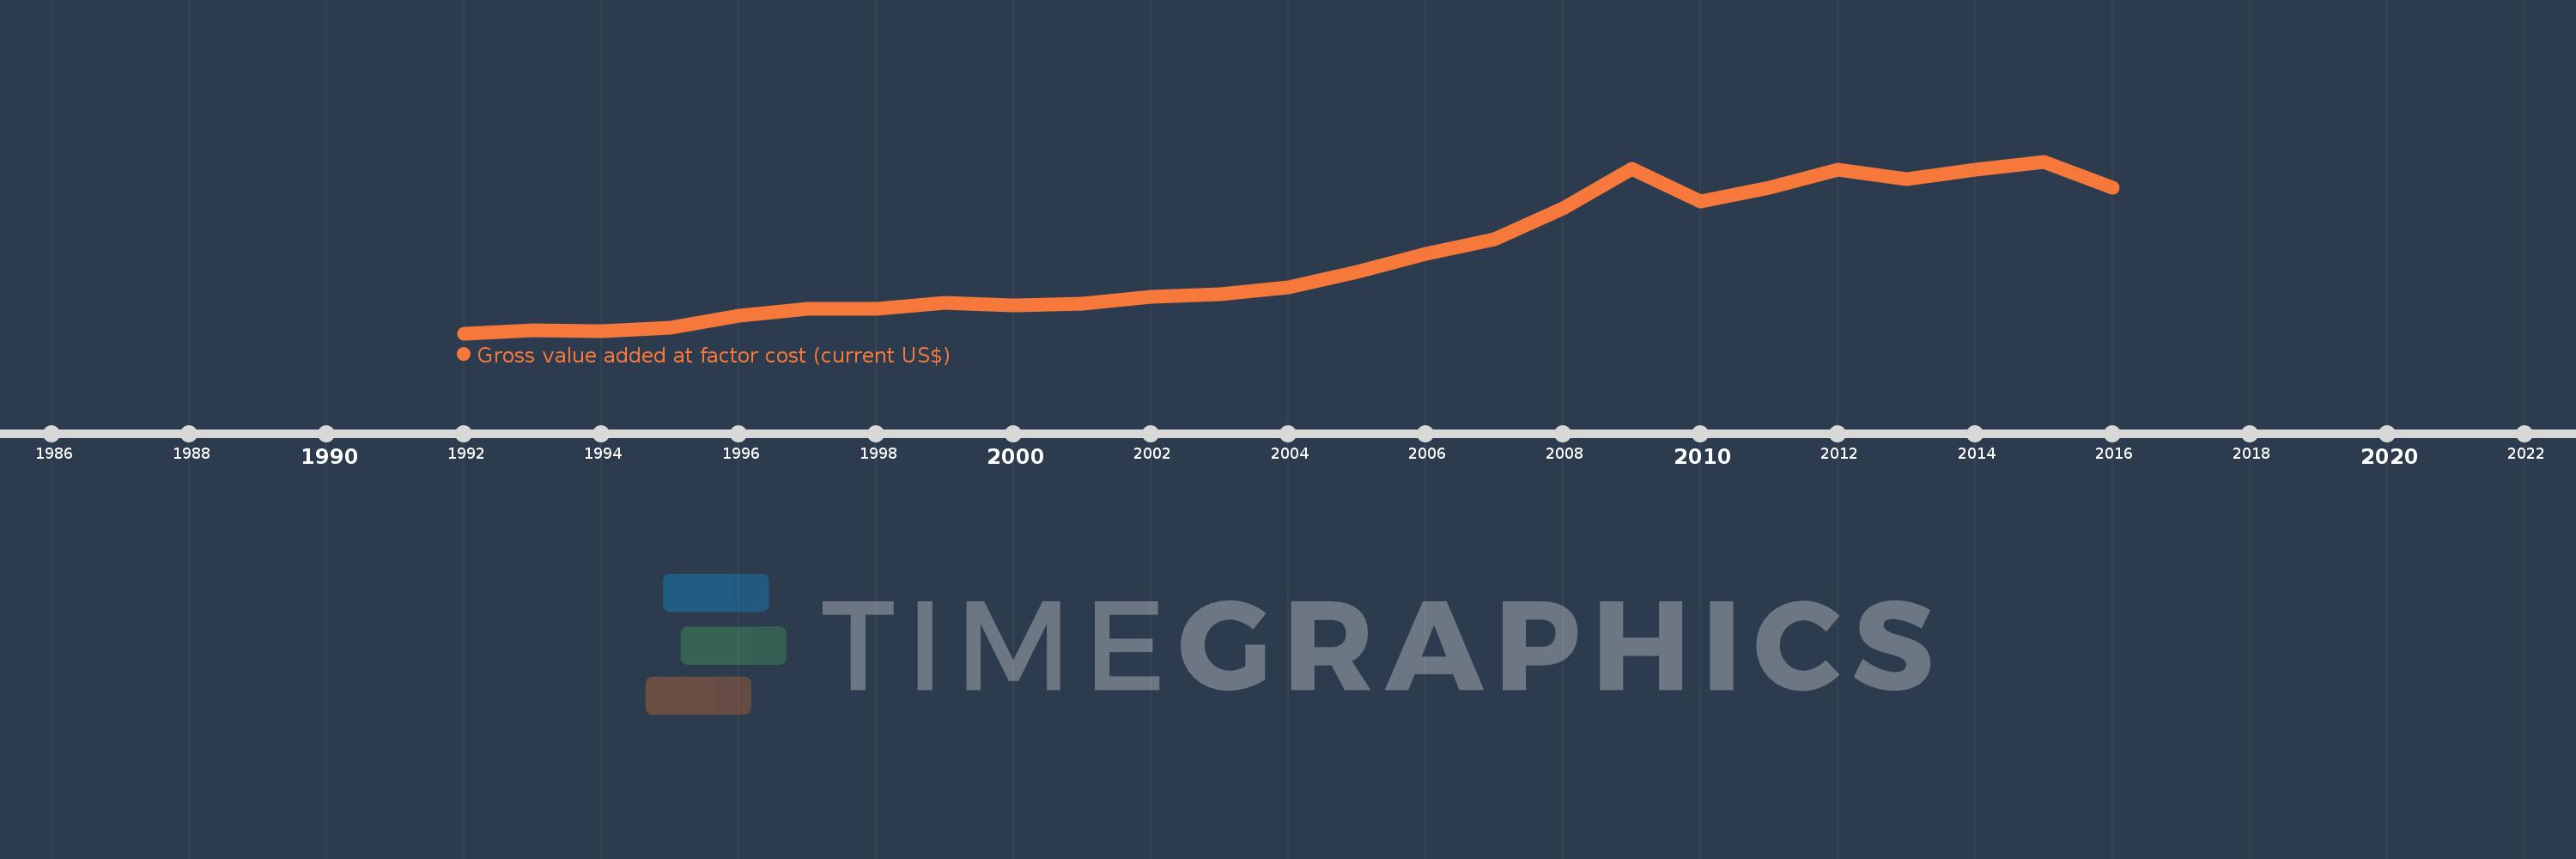
Gross value added at factor cost (current US$)
2016,2015,2014,2013,2012,2011,2010,2009,2008,2007,2006,2005,2004,2003,2002,2001,2000,1999,1998,1997,1996,1995,1994,1993,1992
This statistics in other country:
AfghanistanAlbaniaAlgeriaAndorraAntigua and BarbudaArgentinaArmeniaArubaAustraliaAustriaAzerbaijanBahamas, TheBahrainBangladeshBarbadosBelarusBelgiumBelizeBeninBermudaBhutanBoliviaBosnia and HerzegovinaBotswanaBrazilBulgariaBurkina FasoBurundiCabo VerdeCambodiaCameroonCanadaCaribbean small statesCayman IslandsCentral African RepublicCentral Europe and the BalticsChadChileColombiaCongo, Dem. Rep.Costa RicaCroatiaCubaCyprusCzech RepublicDenmarkDjiboutiDominicaDominican RepublicEarly-demographic dividendEcuadorEgypt, Arab Rep.El SalvadorEquatorial GuineaEritreaEstoniaEthiopiaEuro areaEurope & Central AsiaEurope & Central Asia (excluding high income)Europe & Central Asia (IDA & IBRD countries)European UnionFaroe IslandsFijiFinlandFranceGabonGambia, TheGeorgiaGermanyGhanaGreeceGrenadaGuatemalaGuineaGuinea-BissauGuyanaHeavily indebted poor countries (HIPC)High incomeHondurasHong Kong SAR, ChinaHungaryIcelandIDA blendIDA onlyIDA totalIndiaIndonesiaIran, Islamic Rep.IrelandItalyJamaicaJapanJordanKazakhstanKenyaKiribatiKorea, Rep.KosovoKuwaitKyrgyz RepublicLao PDRLatin America & Caribbean Latin America & Caribbean (excluding high income)Latin America & the Caribbean (IDA & IBRD countries)LatviaLeast developed countries: UN classificationLebanonLesothoLiberiaLibyaLiechtensteinLithuaniaLow incomeLower middle incomeLuxembourgMacao SAR, ChinaMacedonia, FYRMadagascarMalawiMalaysiaMaldivesMaliMaltaMarshall IslandsMauritaniaMauritiusMexicoMicronesia, Fed. Sts.Middle East & North Africa (excluding high income)Middle East & North Africa (IDA & IBRD countries)MoldovaMongoliaMontenegroMoroccoMozambiqueNamibiaNepalNetherlandsNew ZealandNicaraguaNigeriaNorth AmericaNorwayOECD membersOmanPacific island small statesPakistanPalauPanamaPapua New GuineaParaguayPeruPolandPortugalPost-demographic dividendPre-demographic dividendRomaniaRussian FederationRwandaSao Tome and PrincipeSenegalSerbiaSeychellesSierra LeoneSingaporeSlovak RepublicSloveniaSolomon IslandsSouth AfricaSouth AsiaSouth Asia (IDA & IBRD)SpainSri LankaSt. Kitts and NevisSt. LuciaSt. Vincent and the GrenadinesSub-Saharan Africa Sub-Saharan Africa (excluding high income)Sub-Saharan Africa (IDA & IBRD countries)SudanSurinameSwazilandSwedenSwitzerlandSyrian Arab RepublicTajikistanTanzaniaThailandTimor-LesteTongaTrinidad and TobagoTunisiaTurkeyTurkmenistanTuvaluUgandaUkraineUnited KingdomUnited StatesUruguayUzbekistanVanuatuVenezuela, RBVietnamWest Bank and GazaWorldYemen, Rep.ZambiaZimbabwe Timeline:
This timeline shows a graph from 1992 to 2016 of Poland. No data until 1991. Number of actual observations by date: 25.
Source name:
World Development Indicators
Source organization:
World Bank national accounts data, and OECD National Accounts data files.
Categories, topics:
Economy & Growth
Last updated:
apr 23, 2017
Indicators value changes by year
Minimum:
83.722 bln
jan 1, 1992
Maximum:
483.417 bln
jan 1, 2015
At the date of observation
Value
Absolute change
Change from previous value
jan 1, 1992
83.722 bln
+83.722 bln
0.0%
jan 1, 1993
91.652 bln
+7.93 bln
9.47%
jan 1, 1994
89.68 bln
-1.972 bln
-2.15%
jan 1, 1995
96.921 bln
+7.241 bln
8.07%
jan 1, 1996
125.355 bln
+28.434 bln
29.34%
jan 1, 1997
140.673 bln
+15.318 bln
12.22%
jan 1, 1998
140.323 bln
-349.889 mln
-0.25%
jan 1, 1999
154.66 bln
+14.338 bln
10.22%
jan 1, 2000
149.247 bln
-5.413 bln
-3.5%
jan 1, 2001
152.521 bln
+3.274 bln
2.19%
jan 1, 2002
169.336 bln
+16.815 bln
11.03%
jan 1, 2003
175.238 bln
+5.901 bln
3.48%
jan 1, 2004
191.621 bln
+16.384 bln
9.35%
jan 1, 2005
225.652 bln
+34.031 bln
17.76%
jan 1, 2006
269.008 bln
+43.356 bln
19.21%
jan 1, 2007
302.217 bln
+33.208 bln
12.34%
jan 1, 2008
374.629 bln
+72.412 bln
23.96%
jan 1, 2009
466.47 bln
+91.841 bln
24.52%
jan 1, 2010
391.045 bln
-75.425 bln
-16.17%
jan 1, 2011
421.674 bln
+30.63 bln
7.83%
jan 1, 2012
464.748 bln
+43.074 bln
10.21%
jan 1, 2013
443.3 bln
-21.448 bln
-4.62%
jan 1, 2014
465.372 bln
+22.073 bln
4.98%
jan 1, 2015
483.417 bln
+18.045 bln
3.88%
jan 1, 2016
423.206 bln
-60.211 bln
-12.46%
Ranking of countries by current statistics by years


Comments: